 ReddRadar

SnappyCharts - Alternatives & Competitors
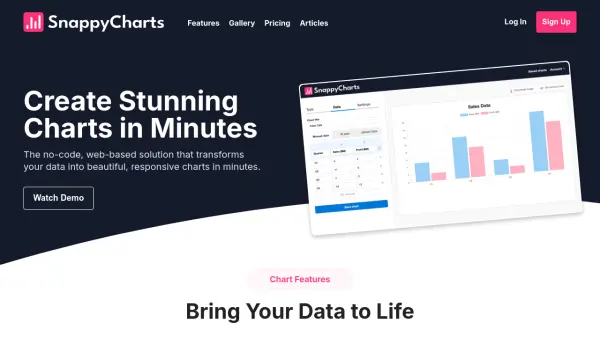
Create stunning charts in minutes with no coding required
SnappyCharts is a no-code, web-based solution that transforms data into beautiful, responsive charts quickly and easily.
Ranked by Relevance
-
1
 ImgCharts Free Chart Maker for Amazing Visualizations
ImgCharts is a free online chart maker that enables users to create various types of charts instantly without requiring sign-up, offering a user-friendly interface for data visualization.
- Free
-
2
 MakeCharts Visualize Complexity into Clarity
MakeCharts is an AI-powered visualization tool that transforms data, ideas, and plans into clear, shareable visuals including charts, diagrams, timelines, and frameworks in minutes.
- Freemium
- From 7$
-
3
 Visual.is Create beautiful and dynamic data visualizations easily
Visual.is is an AI-powered platform that enables users to create professional reports, charts, and dashboards without technical expertise, offering user-friendly tools with beautiful design templates.
- Freemium
- From 8$
-
4
 My Little Chart Rapid, Beautiful Chart Creation with Real-Time Data Sync
My Little Chart enables analysts and creatives to swiftly generate customizable, visually engaging charts and graphs, synchronizing data in real time for impactful presentations and seamless integration. Enjoy easy data imports, broad personalization, and effortless embedding across modern platforms.
- Freemium
- From 2$
-
5
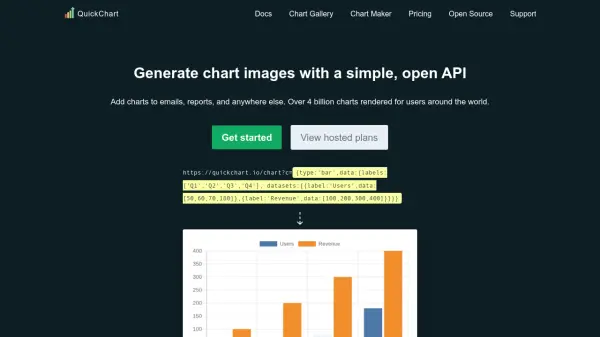 QuickChart Generate Chart Images and QR Codes Instantly via a Flexible API
QuickChart provides a powerful API to dynamically render customizable chart images and QR codes for integration into reports, emails, and applications. Trusted by developers and businesses worldwide, QuickChart supports advanced customization, no-code tools, and open-source flexibility.
- Freemium
- From 40$
-
6
 InstaCharts Instant Data Visualization and Smart Chart Creation
InstaCharts is an intuitive data visualization tool that uses smart technology to automatically generate interactive charts and tables from your spreadsheet data. Easily create, customize, share, and embed compelling visualizations for reports, websites, and data exploration.
- Freemium
- From 10$
-
7
 ApexCharts Modern & Interactive Open-source Charts for Developers
ApexCharts is an open-source charting library that enables developers to create beautiful, interactive data visualizations for web applications with extensive API documentation and multiple chart types.
- Freemium
- From 17$
-
8
 ChartPixel Automated charts and insights in 30 seconds
ChartPixel is an AI-powered data analysis platform that transforms complex data into clear visualizations and actionable insights without coding. It offers automated data cleaning, statistical analysis, and instant chart generation suitable for both beginners and professionals.
- Freemium
- From 15$
-
9
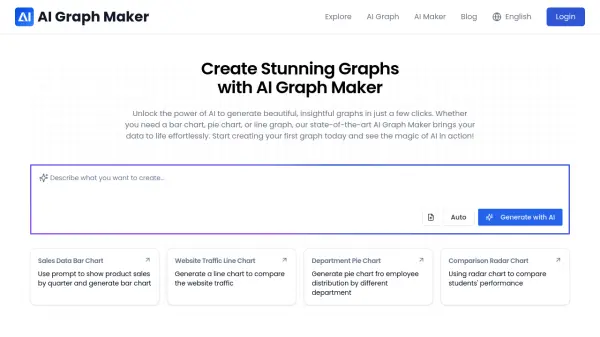 AI Graph Maker Create Stunning Graphs with AI
AI Graph Maker uses AI to generate various types of insightful graphs, including bar charts, pie charts, and line graphs. Start creating data visualizations effortlessly.
- Free
-
10
 Chartworks Complex financial data made beautiful. Everywhere.
Chartworks provides interactive HTML5 charts, image-based charts, and mobile SDKs for visualizing complex financial data across web, mobile, and various platforms with responsive design and easy integration.
- Contact for Pricing
-
11
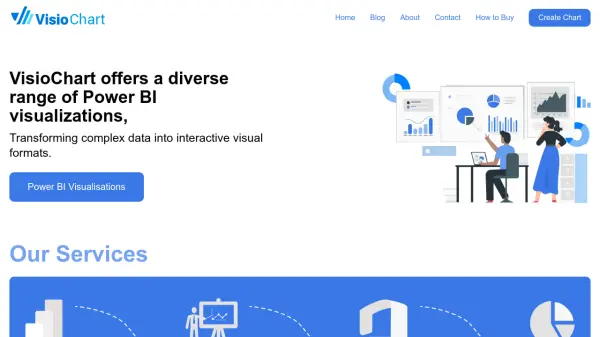 VisioChart Transforming complex data into interactive visual formats.
VisioChart offers a diverse range of Power BI visualizations to transform complex data into interactive visual formats, enabling users to create engaging charts without coding or design skills.
- Contact for Pricing
-
12
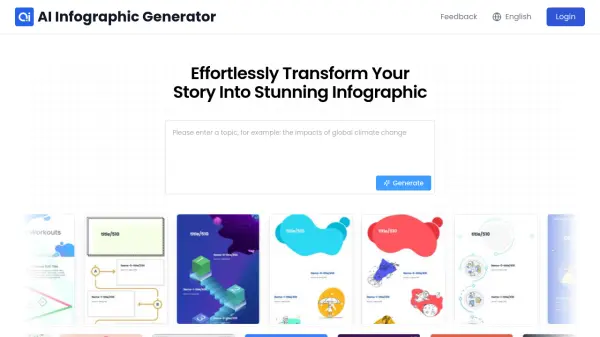 InfographAI Effortlessly Transform Your Story Into Stunning Infographics
InfographAI is an AI-powered infographic generator that transforms data and content into professional-quality visual presentations without requiring design skills. It offers smart layout optimization, automated data visualization, and customizable templates.
- Free
-
13
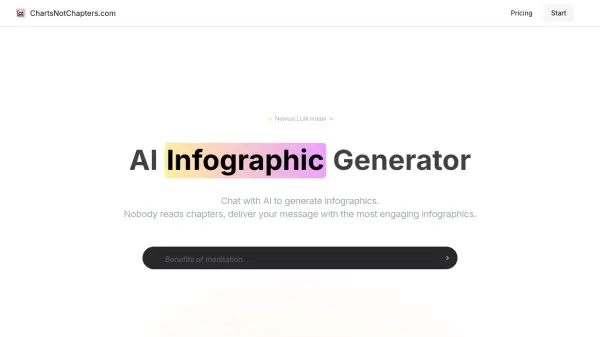 ChartsNotChapters.com AI Infographic Generator
ChartsNotChapters.com is an AI-powered infographic generator that allows users to create engaging visuals from text, CSV, or by chatting with AI. It offers smart format selection and extensive customization options, all generated from scratch.
- Usage Based
- From 3$
-
14
 Datawrapper Create better charts, maps, and tables with ease
Datawrapper is a powerful web application that enables users to design and publish high-quality data visualizations, including charts, maps, and tables, with professional and accessible results.
- Freemium
- From 599$
-
15
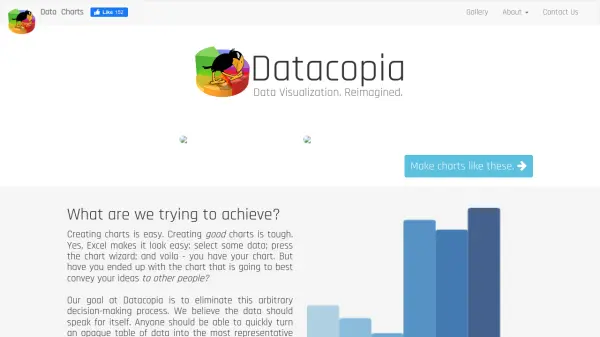 Datacopia Effortless Data Visualization for Everyone
Datacopia enables users to effortlessly generate a wide variety of charts and graphs from their data, streamlining data analysis and visualization tasks.
- Other
-
16
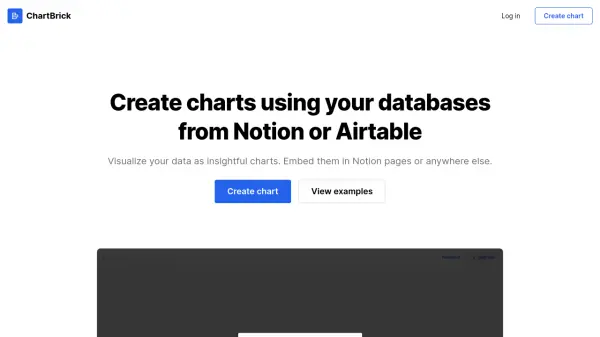 ChartBrick Create charts using your databases from Notion or Airtable
ChartBrick is an AI-powered tool that visualizes data from Notion or Airtable into insightful charts, offering easy embedding and customization without coding.
- Freemium
- From 9$
-
17
 AI Dashboard Design Design your Dashboard with AI
AI Dashboard Design uses artificial intelligence to help users create visually stunning and informative dashboards quickly with a drag-and-drop builder and AI-generated charts.
- Freemium
-
18
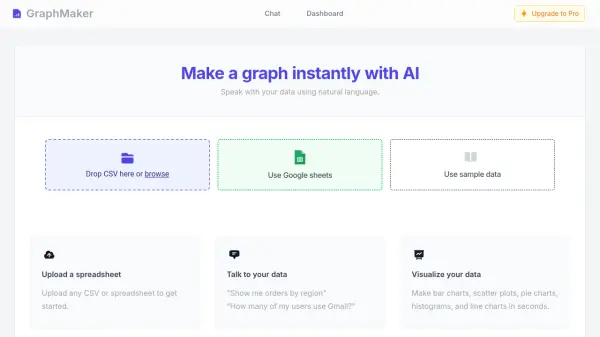 GraphMaker Make a graph instantly with AI
GraphMaker is an AI-powered tool that allows users to create various types of charts and graphs from their data using natural language commands. It supports data input via Google Sheets, sample data, or CSV/spreadsheet uploads.
- Free
-
19
 FusionCharts Build interactive, responsive, and beautiful JavaScript charts for any framework
FusionCharts provides high-performance JavaScript charting libraries for creating interactive, responsive charts and dashboards across frameworks like React, Vue, Angular, and pure JavaScript, trusted by over 800,000 developers.
- Free Trial
-
20
 Insiderviz AI-powered data visualization platform
Insiderviz is an AI tool for creating interactive data visualizations and insights from complex datasets.
- Other
-
21
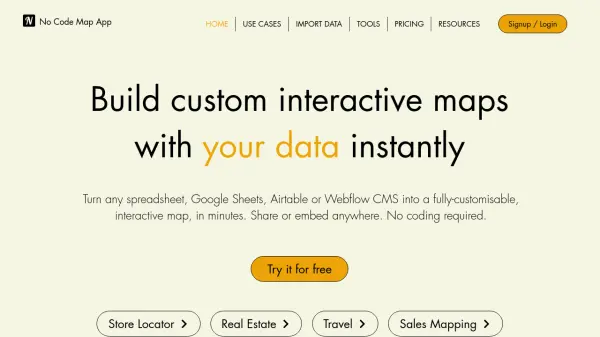 No Code Map App Build custom interactive maps with your data instantly
No Code Map App is an AI-powered platform that transforms spreadsheets, Google Sheets, Airtable, or Webflow CMS into fully customizable, interactive maps in minutes without coding, featuring automatic data sync and AI map styling.
- Freemium
- From 24$
-
22
 Lovely Charts Create professional diagrams for your website with ease
Lovely Charts helps users create various types of professional diagrams including flowcharts, sitemaps, business processes, organization charts, and wireframes for website integration.
- Other
-
23
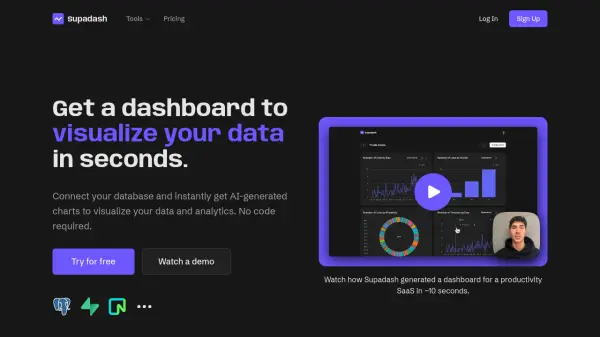 Supadash Get a dashboard to visualize your data in seconds
Supadash is an AI-powered data visualization tool that automatically generates charts and dashboards from database connections, requiring no coding expertise.
- Freemium
- From 7$
-
24
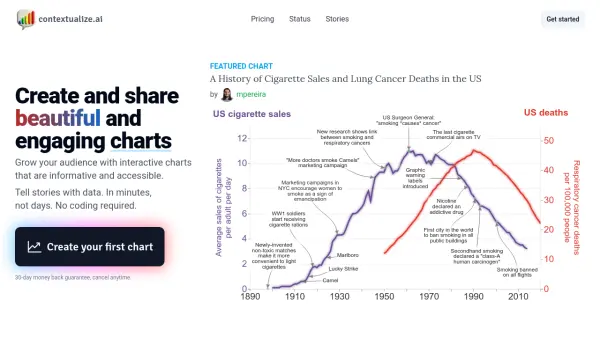 contextualize.ai Tell stories with data. In minutes, not days. No coding required.
Contextualize.ai enables users to create and share interactive, annotated charts to tell compelling stories with data quickly and without coding, featuring AI-powered insights.
- Freemium
- From 19$
-
25
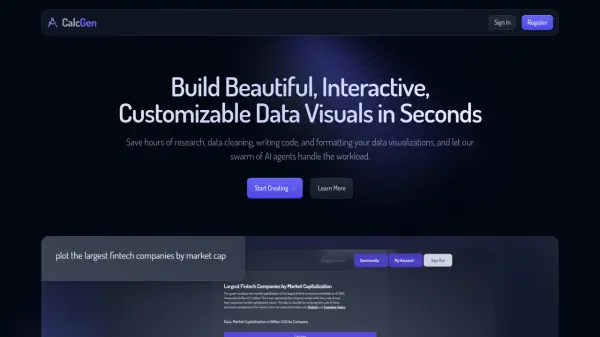 welcome.calcgen.ai Build Beautiful, Interactive, Customizable Data Visuals in Seconds
CalcGen uses a swarm of AI agents to automatically research, analyze, and create interactive, customizable data visualizations from a single prompt.
- Paid
- From 10$
-
26
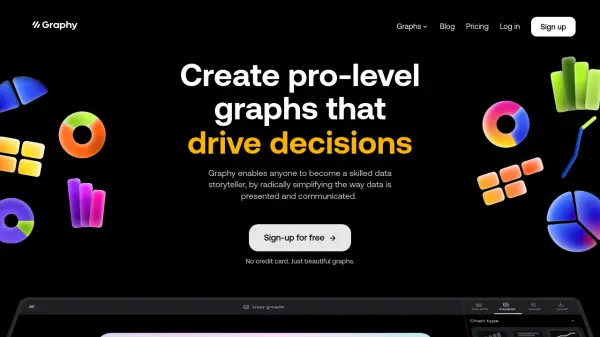 Graphy Create pro-level graphs that inspire actions.
Graphy simplifies data presentation and communication, enabling anyone to become a skilled data storyteller. Its AI-powered features create actionable insights and drive faster decisions.
- Freemium
- From 8$
-
27
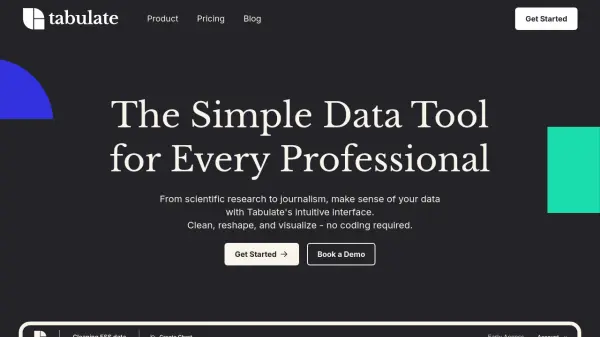 Tabulate The Simple Data Tool for Every Professional
Tabulate is a user-friendly SaaS data tool designed to simplify data preparation and visualization for professionals without coding skills.
- Freemium
- From 22$
-
28
 infographicgeneratorai.com Create Amazing Infographics
AI Infographics is a tool that generates stunning infographics for marketing and business using AI. Create high-quality visuals easily by describing your needs and optionally uploading data.
- Paid
- From 19$
-
29
 Piktochart Transform complex ideas into captivating visuals in seconds
Piktochart is an AI-powered visual design platform that helps users create professional infographics, presentations, and reports with automated design generation and brand consistency features.
- Freemium
- From 14$
-
30
 ChartGo Create Professional Charts Online for Free
ChartGo is a free online tool designed to help users easily create, customize, and export a wide range of chart types, making data visualization accessible for everyone.
- Free
-
31
 Infogram Create Interactive Data Visualizations with AI
Infogram is a data visualization platform that allows users to create interactive charts, maps, infographics, reports, and more. Leverage AI to enhance your workflow and share or embed your creations anywhere.
- Freemium
- From 19$
-
32
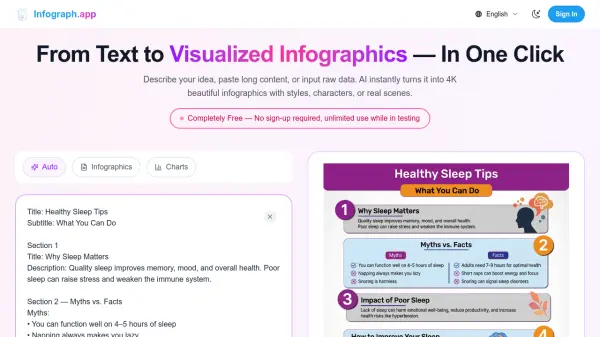 Infograph.app From Text to Visualized Infographics - In One Click
Infograph.app is an AI-powered tool that instantly transforms text, content, or raw data into beautiful 4K infographics, charts, and diagrams with customizable styles and formats.
- Freemium
-
33
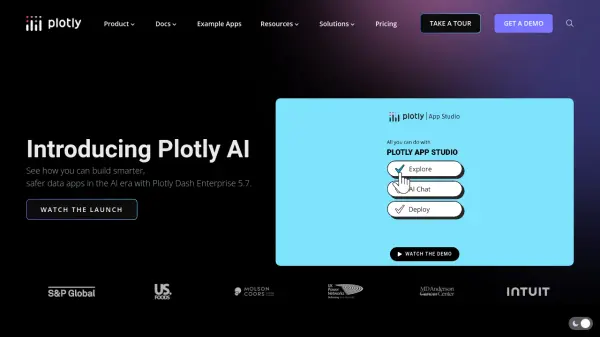 Plotly Beautiful data visualizations to stunning data apps with AI
Plotly enables users to create interactive data visualizations and AI-powered data applications using Python. It offers both open-source tools and an enterprise platform for development, deployment, and scaling.
- Freemium
-
34
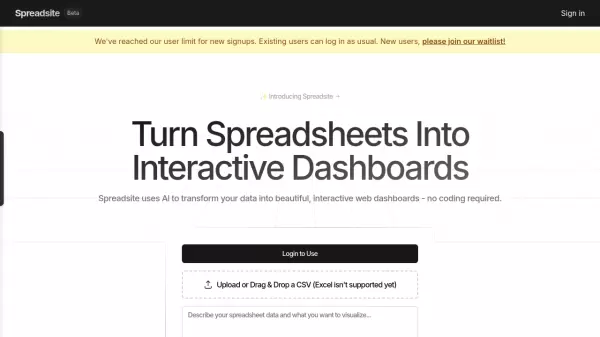 Spreadsite Turn Spreadsheets Into Interactive Dashboards
Spreadsite is an AI-powered tool that transforms spreadsheet data into beautiful, interactive web dashboards without requiring any coding skills.
- Freemium
-
35
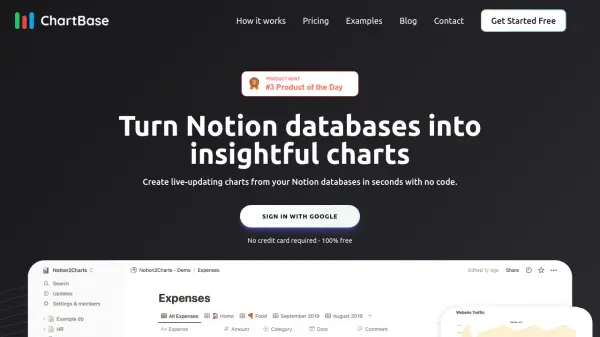 ChartBase Transform Notion Databases into Dynamic, Insightful Charts Instantly
ChartBase enables users to effortlessly convert Notion databases into live-updating, customizable charts with no coding required. The platform offers a user-friendly interface, multiple export options, and advanced chart customization for streamlined data visualization.
- Freemium
- From 3$
-
36
 AiInfographix AI-Powered Design
AiInfographix uses AI to create stunning infographics in seconds. It's perfect for social media, presentations, and reports, requiring no design skills.
- Pay Once
-
37
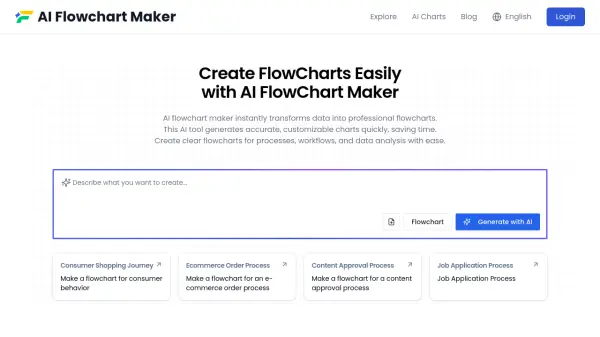 AI Flowchart Maker Create FlowCharts Easily with AI FlowChart Maker
AI Flowchart Maker is an AI-powered tool that automatically generates professional flowcharts from text or data inputs, simplifying process visualization and workflow mapping.
- Freemium
-
38
 SnipOwl Unlock Instant Insights Across All Your Platforms - Without Ever Writing a Line of Code!
SnipOwl provides a real-time dashboard to analyze data, monitor performance, and track progress across multiple platforms without needing to switch between tabs.
- Paid
- From 12$
-
39
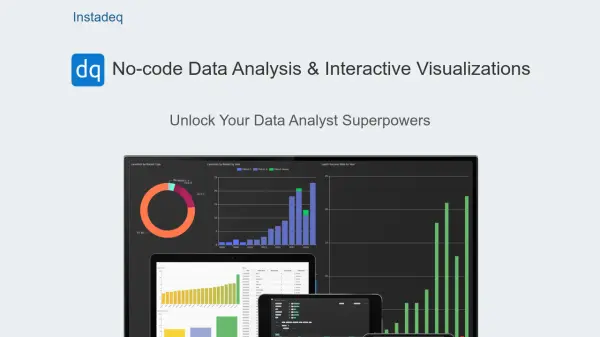 Instadeq No-code Data Analysis & Interactive Visualizations
Instadeq is a no-code platform enabling users to transform various data sources like spreadsheets and APIs into interactive, always up-to-date dashboards.
- Contact for Pricing
-
40
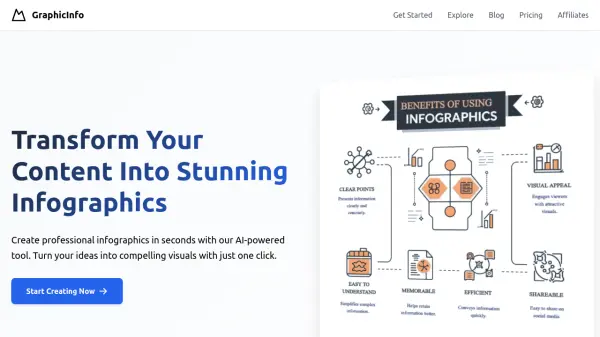 GraphicInfo Transform Your Content Into Stunning Infographics
GraphicInfo is an AI-powered tool that transforms content into professional infographics in seconds, offering instant visualization and customization capabilities.
- Contact for Pricing
-
41
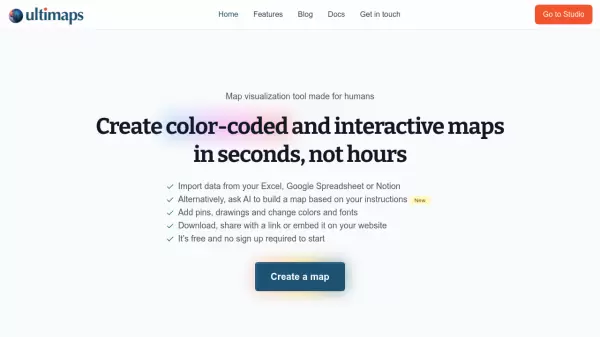 Ultimaps Map visualization tool made for humans
Ultimaps is an intuitive map visualization platform that allows users to create color-coded and interactive maps instantly by importing data from Excel, Google Spreadsheet, or Notion, with AI-assisted map creation capabilities.
- Freemium
- From 17$
-
42
 Gantt.io Create beautiful Gantt charts with full customization in no time
Gantt.io is an AI-powered tool that enables professionals to design and customize Gantt charts efficiently, offering unlimited charts, style editing, and multiple export options.
- Freemium
- From 8$
-
43
 Snappa Create online graphics in a snap.
Snappa is a cloud-based graphics editor that simplifies the creation of visuals for social media, ads, blogs, and more. It offers pre-made templates, a vast library of royalty-free images, and user-friendly editing tools.
- Freemium
- From 15$
-
44
 Visflow Boost Your Workflow with AI-Powered Flowchart Generation
Visflow allows users to map complex ideas into clear visual flowcharts, incorporating multimedia elements like audio and video for dynamic diagrams. It prioritizes privacy, storing data locally on the user's device.
- Free
-
45
 Quadrigram Turn your data into knowledge with interactive visualizations
Quadrigram is a visual drag-and-drop data editor that transforms data into engaging stories through interactive visualizations, combining texts, images, and charts without coding skills.
- Freemium
- From 20$
-
46
 Onvo AI Embeddable AI Dashboards and Reports for Your Customers
Onvo AI is an intelligent dashboard creation platform that enables users to build and customize data visualizations using natural language prompts, eliminating the need for complex SQL queries or coding.
- Paid
- From 169$
-
47
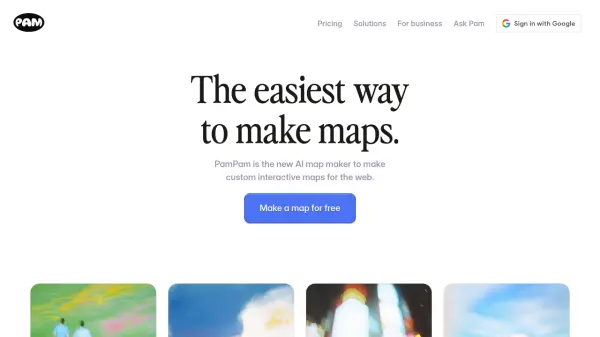 PamPam AI-powered interactive map maker for custom web maps.
PamPam is an AI map maker enabling users to easily create custom, interactive maps for websites without coding. Import data, customize design, and embed maps effortlessly.
- Freemium
- From 29$
-
48
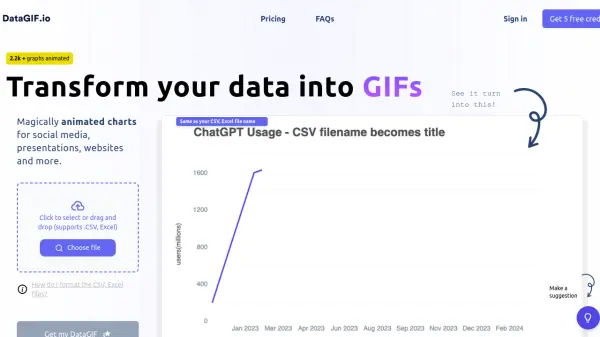 DataGIF.io Transform Your Data into Engaging Animated GIFs
DataGIF.io is an AI-powered tool that transforms data from CSV or Excel files into animated charts for social media, websites, and presentations.
- Usage Based
-
49
 Chartbrew Actionable insights for your team and clients
Chartbrew is an AI-powered data visualization and reporting platform that helps teams create interactive dashboards and reports from multiple data sources to track KPIs and improve decision-making.
- Freemium
- From 24$
-
50
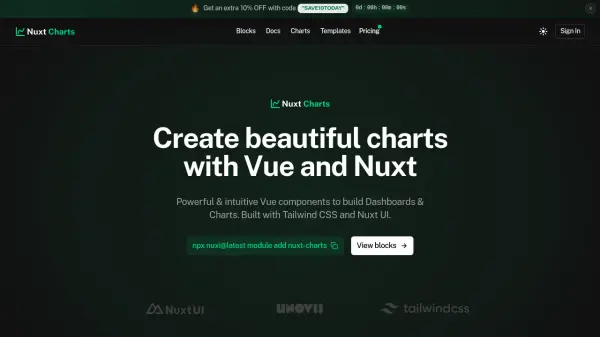 Nuxt Charts Powerful & intuitive Vue components to build Dashboards & Charts.
Nuxt Charts offers advanced and customizable Vue components for creating professional dashboards and data visualizations, seamlessly integrating with Nuxt UI and Tailwind CSS.
- Pay Once
Didn't find tool you were looking for?