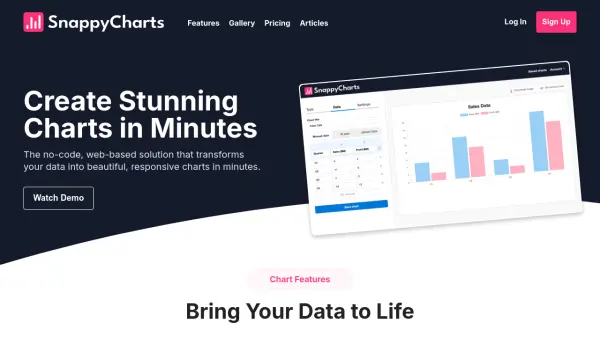
What is SnappyCharts?
SnappyCharts is a web-based data visualization tool designed to help users create professional charts without any coding knowledge. It offers a simple chart builder where users can select chart types, enter or import data, and customize settings to produce responsive visualizations that automatically resize for different devices.
The platform supports various chart types including bar, line, pie, and doughnut charts, with highly customizable color options using pre-set palettes or custom creations. Users can export high-quality images for presentations or embed interactive versions on websites. Charts are securely saved for future editing, and Pro users can leverage AI to generate data from prompts, transforming ideas into data-driven stories.
Features
- No Coding Needed: Use simple chart builder to select charts, enter data, and choose settings
- Embed Responsive Charts: Charts automatically resize for different devices
- Highly Customizable: Choose from bar, line, pie, and doughnut charts with customizable colors
- Share Your Charts Anywhere: Export high-quality images or embed interactive versions on websites
- Save and Edit Anytime: Charts are securely saved for future updates and adjustments
- Create Charts with AI: Generate data for charts using AI prompts (Pro users only)
Use Cases
- Creating data visualizations for business presentations
- Embedding interactive charts on websites or blogs
- Generating charts for academic research or reports
- Developing marketing materials with data-driven graphics
- Producing charts for internal company communications
Related Queries
Helpful for people in the following professions
SnappyCharts Uptime Monitor
Average Uptime
0%
Average Response Time
0 ms