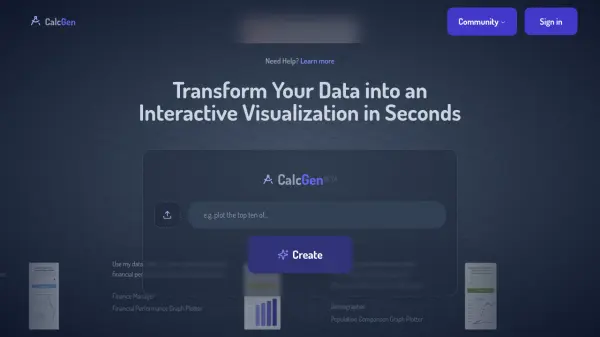
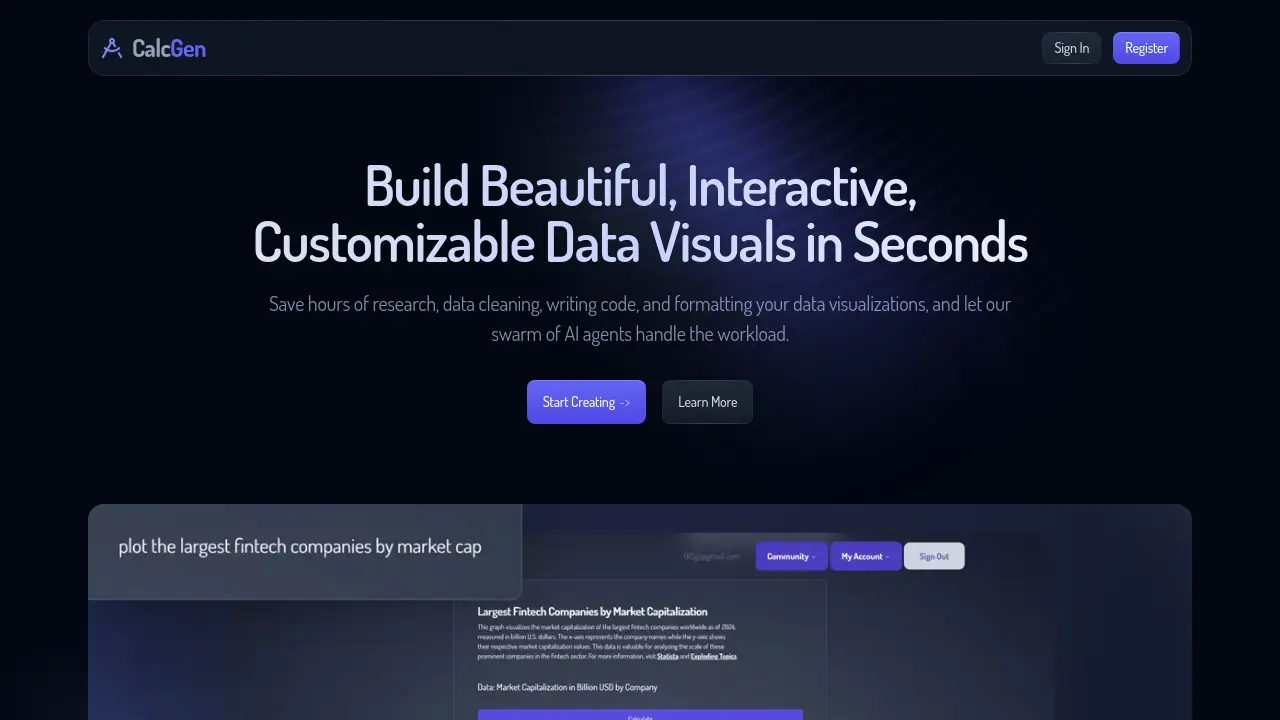
What is welcome.calcgen.ai?
CalcGen leverages a swarm of specialized AI agents—Search, Analysis, and Visualization—to streamline the process of creating data visuals. Users simply input a prompt describing their needs, and the AI handles the research, data cleaning, analysis, coding, and formatting. The Search Agent scours the internet for relevant information, linking credible sources for verification.
The platform automatically generates titles and detailed analyses for the charts through its Analysis Agent. CalcGen offers extensive customization options, allowing users to tailor visualizations with specific chart types, filters, sorting options, pre-built themes, and editable titles and descriptions to match their brand or narrative. The resulting interactive visuals can be easily embedded into various platforms like Notion, Powerpoint, Wordpress, and Wix.
Features
- Automated Data Research: AI agents search the internet for relevant data and provide source links.
- AI-Powered Analysis: Automatically generates titles and detailed analyses for visualizations.
- Prompt-Based Visualization: Create charts by describing requirements in natural language.
- Customizable Visuals: Tailor chart types, filters, sorting, themes, titles, and descriptions.
- Interactive Charts: Generates engaging and interactive data visualizations.
- Theme Library: Offers pre-built themes to match style and brand identity.
- Easy Embedding: Integrate visualizations seamlessly into Notion, Powerpoint, Wordpress, Wix, Miro, and more.
Use Cases
- Generating data visualizations quickly from a simple prompt.
- Automating the research and analysis process for chart creation.
- Creating interactive charts for reports, presentations, or websites.
- Embedding dynamic data visuals into documents and web pages.
- Customizing chart appearance to align with brand guidelines.
- Finding and visualizing data from online sources without manual effort.
FAQs
-
How does CalcGen find the data for visualizations?
CalcGen uses an AI Search Agent that searches the internet for relevant data and provides links to the credible sources it used. -
Can I customize the appearance of the charts generated by CalcGen?
Yes, you can customize visualizations by specifying chart types, filters, sorting options, choosing from pre-built themes, and editing titles and descriptions. -
Where can I use the visualizations created with CalcGen?
The visualizations can be easily embedded into various platforms, including Notion, Powerpoint, Wordpress, Wix, Miro, and more. -
Does CalcGen help with understanding the data?
Yes, an AI Analysis Agent provides a detailed analysis of the data, including generating appropriate titles and write-ups for the charts.
Related Queries
Helpful for people in the following professions

Featured Tools

Join Our Newsletter
Stay updated with the latest AI tools, news, and offers by subscribing to our weekly newsletter.