

Datacopia - Alternatives & Competitors
Effortless Data Visualization for Everyone
Datacopia enables users to effortlessly generate a wide variety of charts and graphs from their data, streamlining data analysis and visualization tasks.
Ranked by Relevance
-
1
 ChartPixel Automated charts and insights in 30 seconds
ChartPixel is an AI-powered data analysis platform that transforms complex data into clear visualizations and actionable insights without coding. It offers automated data cleaning, statistical analysis, and instant chart generation suitable for both beginners and professionals.
- Freemium
- From 15$
-
2
 My Little Chart Rapid, Beautiful Chart Creation with Real-Time Data Sync
My Little Chart enables analysts and creatives to swiftly generate customizable, visually engaging charts and graphs, synchronizing data in real time for impactful presentations and seamless integration. Enjoy easy data imports, broad personalization, and effortless embedding across modern platforms.
- Freemium
- From 2$
-
3
 ImgCharts Free Chart Maker for Amazing Visualizations
ImgCharts is a free online chart maker that enables users to create various types of charts instantly without requiring sign-up, offering a user-friendly interface for data visualization.
- Free
-
4
 MakeCharts Visualize Complexity into Clarity
MakeCharts is an AI-powered visualization tool that transforms data, ideas, and plans into clear, shareable visuals including charts, diagrams, timelines, and frameworks in minutes.
- Freemium
- From 7$
-
5
 InstaCharts Instant Data Visualization and Smart Chart Creation
InstaCharts is an intuitive data visualization tool that uses smart technology to automatically generate interactive charts and tables from your spreadsheet data. Easily create, customize, share, and embed compelling visualizations for reports, websites, and data exploration.
- Freemium
- From 10$
-
6
 Datawrapper Create better charts, maps, and tables with ease
Datawrapper is a powerful web application that enables users to design and publish high-quality data visualizations, including charts, maps, and tables, with professional and accessible results.
- Freemium
- From 599$
-
7
 Visual.is Create beautiful and dynamic data visualizations easily
Visual.is is an AI-powered platform that enables users to create professional reports, charts, and dashboards without technical expertise, offering user-friendly tools with beautiful design templates.
- Freemium
- From 8$
-
8
 Graphy Create pro-level graphs that inspire actions.
Graphy simplifies data presentation and communication, enabling anyone to become a skilled data storyteller. Its AI-powered features create actionable insights and drive faster decisions.
- Freemium
- From 8$
-
9
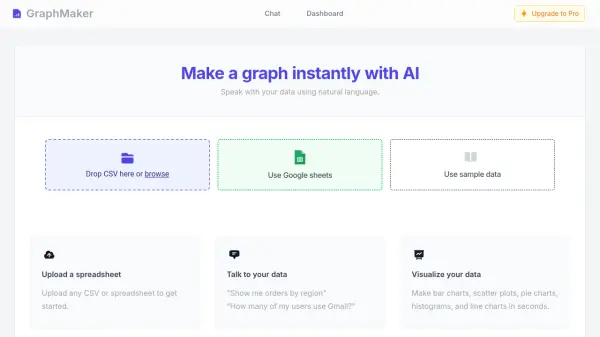 GraphMaker Make a graph instantly with AI
GraphMaker is an AI-powered tool that allows users to create various types of charts and graphs from their data using natural language commands. It supports data input via Google Sheets, sample data, or CSV/spreadsheet uploads.
- Free
-
10
 Insiderviz AI-powered data visualization platform
Insiderviz is an AI tool for creating interactive data visualizations and insights from complex datasets.
- Other
-
11
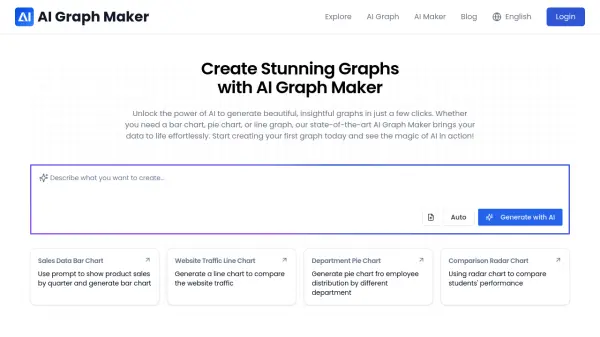 AI Graph Maker Create Stunning Graphs with AI
AI Graph Maker uses AI to generate various types of insightful graphs, including bar charts, pie charts, and line graphs. Start creating data visualizations effortlessly.
- Free
-
12
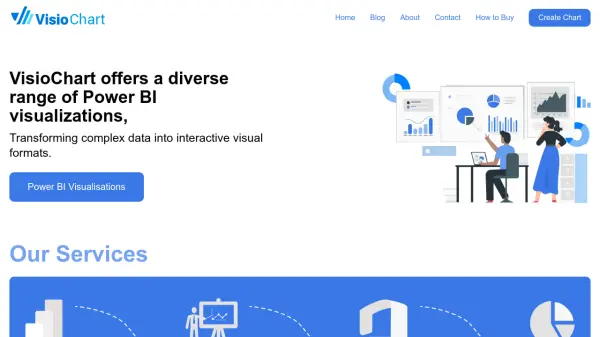 VisioChart Transforming complex data into interactive visual formats.
VisioChart offers a diverse range of Power BI visualizations to transform complex data into interactive visual formats, enabling users to create engaging charts without coding or design skills.
- Contact for Pricing
-
13
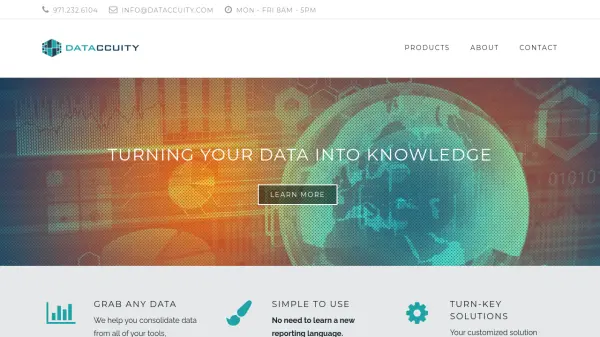 Dataccuity Transform Complex Data Into Actionable Insights and Reports
Dataccuity consolidates data from multiple sources and streamlines reporting, dashboards, and budgeting to empower business decision-making.
- Contact for Pricing
-
14
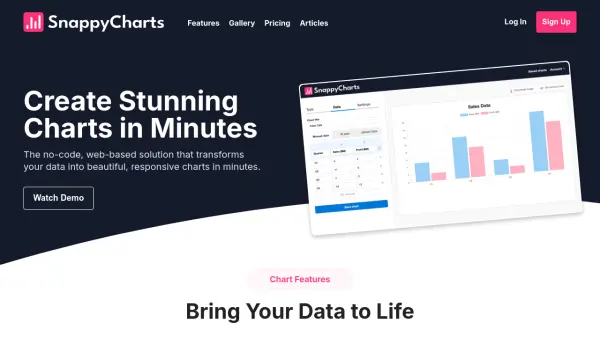 SnappyCharts Create stunning charts in minutes with no coding required
SnappyCharts is a no-code, web-based solution that transforms data into beautiful, responsive charts quickly and easily.
- Freemium
- From 10$
-
15
 SheetBot AI AI-Powered Data Analysis and Visualization Assistant
SheetBot AI is an intelligent data analysis tool that automates data visualization and streamlines complex analytical tasks, helping users create professional graphs and insights instantly.
- Contact for Pricing
-
16
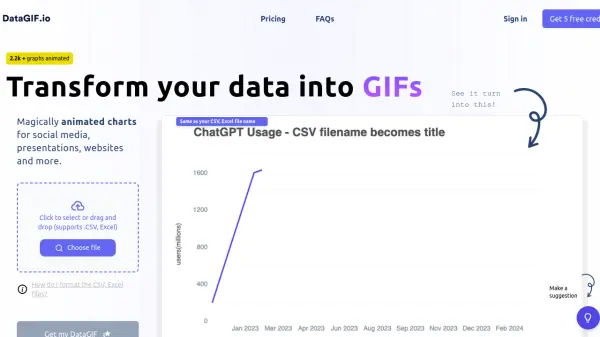 DataGIF.io Transform Your Data into Engaging Animated GIFs
DataGIF.io is an AI-powered tool that transforms data from CSV or Excel files into animated charts for social media, websites, and presentations.
- Usage Based
-
17
 Tabulate The Simple Data Tool for Every Professional
Tabulate is a user-friendly SaaS data tool designed to simplify data preparation and visualization for professionals without coding skills.
- Freemium
- From 22$
-
18
 ApexCharts Modern & Interactive Open-source Charts for Developers
ApexCharts is an open-source charting library that enables developers to create beautiful, interactive data visualizations for web applications with extensive API documentation and multiple chart types.
- Freemium
- From 17$
-
19
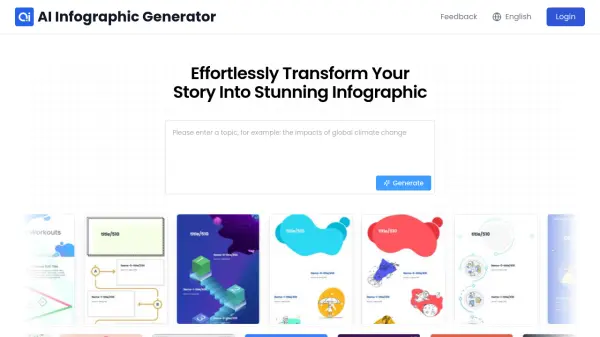 InfographAI Effortlessly Transform Your Story Into Stunning Infographics
InfographAI is an AI-powered infographic generator that transforms data and content into professional-quality visual presentations without requiring design skills. It offers smart layout optimization, automated data visualization, and customizable templates.
- Free
-
20
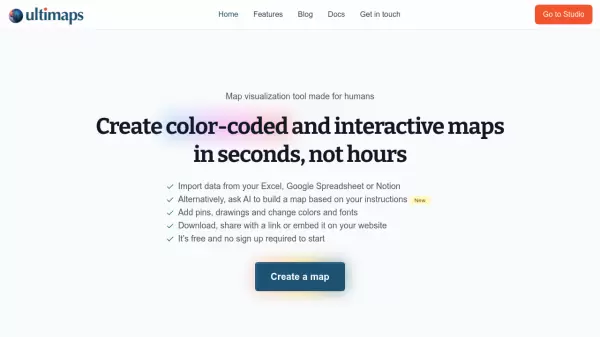 Ultimaps Map visualization tool made for humans
Ultimaps is an intuitive map visualization platform that allows users to create color-coded and interactive maps instantly by importing data from Excel, Google Spreadsheet, or Notion, with AI-assisted map creation capabilities.
- Freemium
- From 17$
-
21
 Chartworks Complex financial data made beautiful. Everywhere.
Chartworks provides interactive HTML5 charts, image-based charts, and mobile SDKs for visualizing complex financial data across web, mobile, and various platforms with responsive design and easy integration.
- Contact for Pricing
-
22
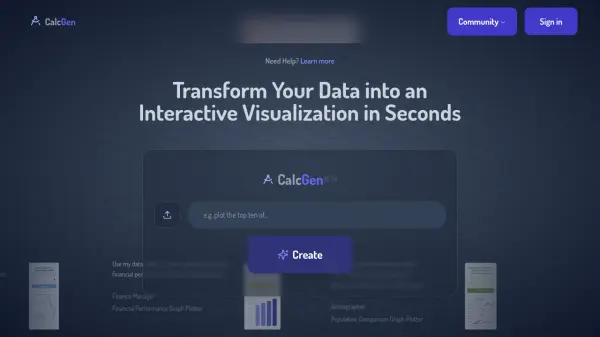 CalcGen Transform Your Data into an Interactive Visualization in Seconds
CalcGen is a tool that instantly generates interactive visualizations and calculators from user-provided data or conceptual prompts.
- Free
-
23
 Datylon A dataviz platform to design, automate and share data-rich, beautiful & on-brand reports.
Datylon is a comprehensive data visualization platform that enables users to design, automate, and share stunning charts and reports with powerful tools for Adobe Illustrator integration, automated reporting, and embedded visualizations.
- Freemium
- From 22$
-
24
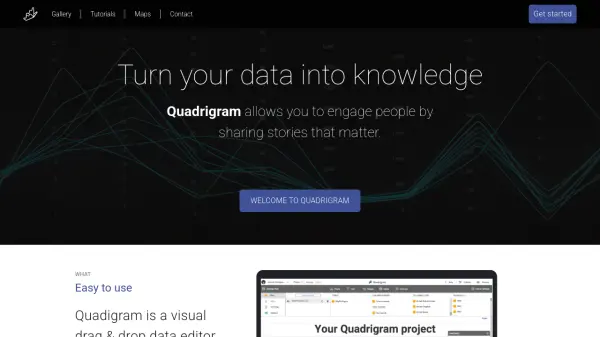 Quadrigram Turn your data into knowledge with interactive visualizations
Quadrigram is a visual drag-and-drop data editor that transforms data into engaging stories through interactive visualizations, combining texts, images, and charts without coding skills.
- Freemium
- From 20$
-
25
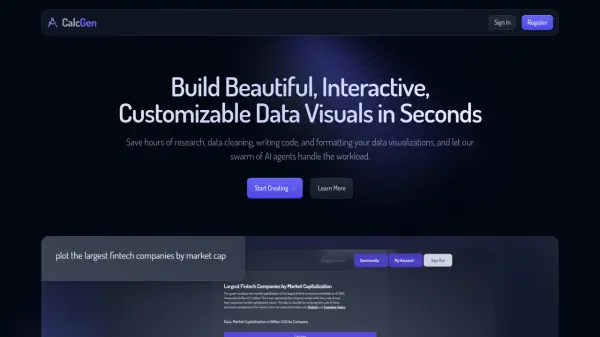 welcome.calcgen.ai Build Beautiful, Interactive, Customizable Data Visuals in Seconds
CalcGen uses a swarm of AI agents to automatically research, analyze, and create interactive, customizable data visualizations from a single prompt.
- Paid
- From 10$
-
26
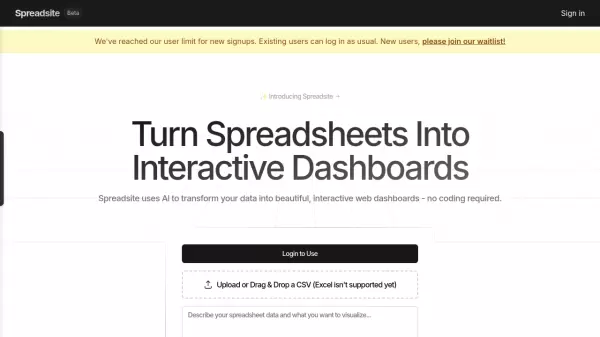 Spreadsite Turn Spreadsheets Into Interactive Dashboards
Spreadsite is an AI-powered tool that transforms spreadsheet data into beautiful, interactive web dashboards without requiring any coding skills.
- Freemium
-
27
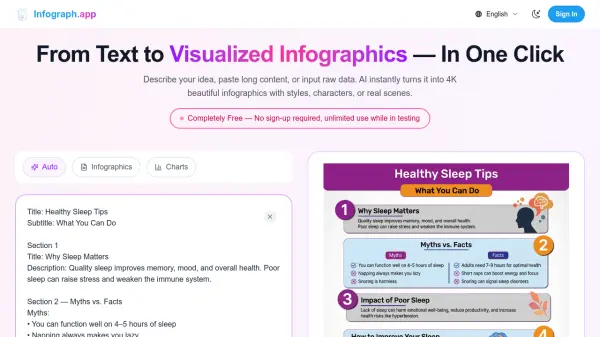 Infograph.app From Text to Visualized Infographics - In One Click
Infograph.app is an AI-powered tool that instantly transforms text, content, or raw data into beautiful 4K infographics, charts, and diagrams with customizable styles and formats.
- Freemium
-
28
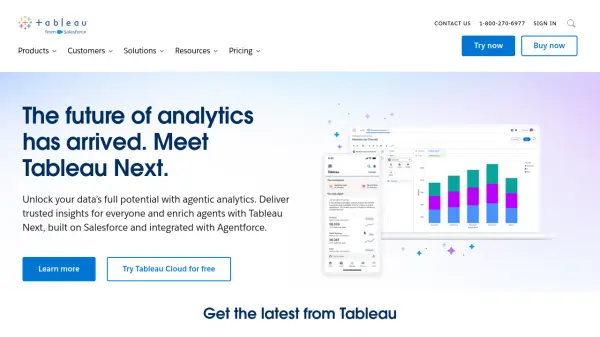 Tableau Tableau helps people see, understand and act on data
Tableau is a visual analytics platform transforming how users interact with data through intuitive visualization, analysis, and AI-powered insights.
- Free Trial
-
29
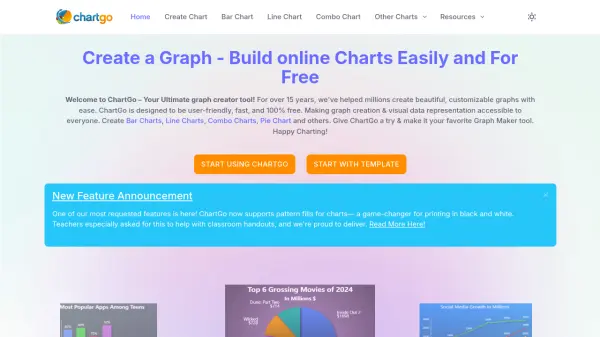 ChartGo Create Professional Charts Online for Free
ChartGo is a free online tool designed to help users easily create, customize, and export a wide range of chart types, making data visualization accessible for everyone.
- Free
-
30
 Lovely Charts Create professional diagrams for your website with ease
Lovely Charts helps users create various types of professional diagrams including flowcharts, sitemaps, business processes, organization charts, and wireframes for website integration.
- Other
-
31
 Reporfy Insightful Reports at the Speed of AI
Reporfy is an AI-powered platform that helps teams create, share, and interact with beautiful, data-rich reports effortlessly. It transforms complex data into actionable insights through visual storytelling and collaborative features.
- Freemium
- From 39$
-
32
 Line.do Create Infographics and Reports Online
Line.do is an online platform for creating infographics and reports, offering tools for visual communication and diagram generation.
- Other
-
33
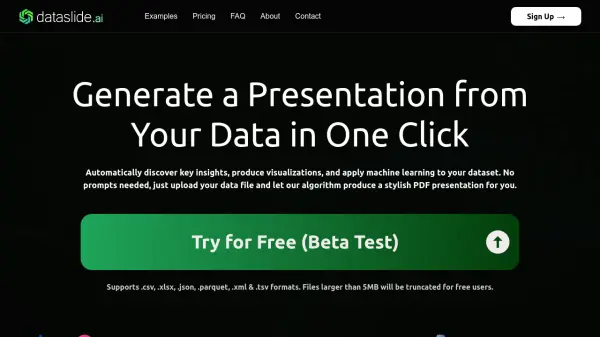 Dataslide AI Generate a Presentation from Your Data in One Click
Dataslide AI is an automated data analysis tool that transforms raw data files into comprehensive PDF presentations with visualizations and machine learning insights, requiring no manual prompts.
- Freemium
- From 20$
-
34
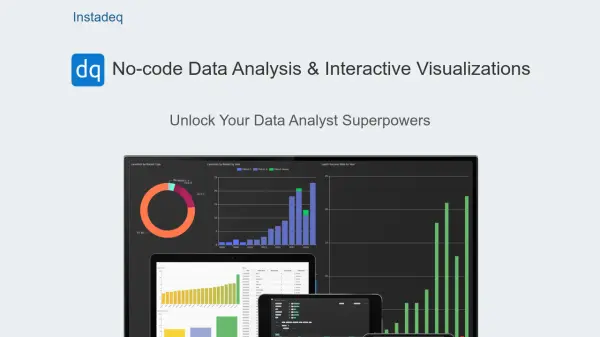 Instadeq No-code Data Analysis & Interactive Visualizations
Instadeq is a no-code platform enabling users to transform various data sources like spreadsheets and APIs into interactive, always up-to-date dashboards.
- Contact for Pricing
-
35
 Recap Your AI Knowledge Space for Insightful Visuals
Recap is an AI-powered browser extension that transforms content into visual summaries through mind maps, timelines, tables, and other visual formats, making information comprehension more intuitive and efficient.
- Free Trial
-
36
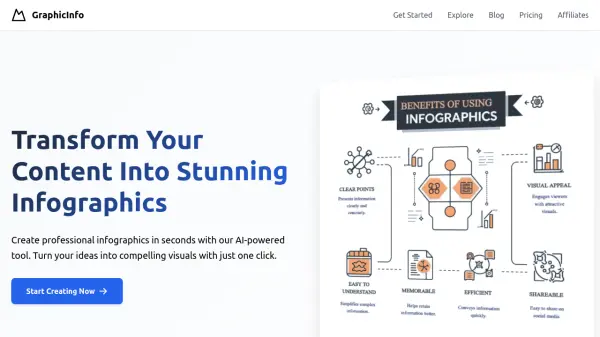 GraphicInfo Transform Your Content Into Stunning Infographics
GraphicInfo is an AI-powered tool that transforms content into professional infographics in seconds, offering instant visualization and customization capabilities.
- Contact for Pricing
-
37
 Elusidate Turn data into reports in 1 click
Elusidate is an AI-powered data analysis and visualization tool that transforms raw data into comprehensive reports, charts, and presentations instantly.
- Freemium
- From 4$
-
38
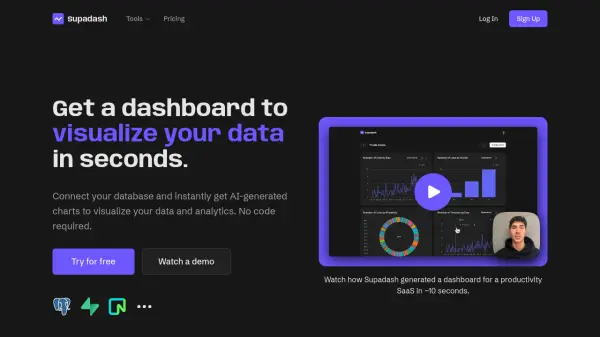 Supadash Get a dashboard to visualize your data in seconds
Supadash is an AI-powered data visualization tool that automatically generates charts and dashboards from database connections, requiring no coding expertise.
- Freemium
- From 7$
-
39
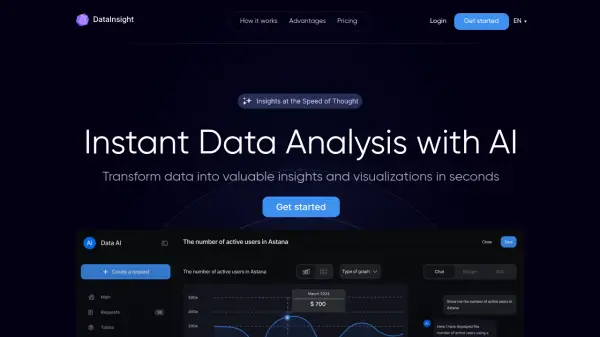 DataInsight Instant Data Analysis with AI
DataInsight transforms data into valuable insights and visualizations in seconds. It connects to major databases and provides instant, AI-powered answers to business queries.
- Paid
- From 200$
-
40
 AI Dashboard Design Design your Dashboard with AI
AI Dashboard Design uses artificial intelligence to help users create visually stunning and informative dashboards quickly with a drag-and-drop builder and AI-generated charts.
- Freemium
-
41
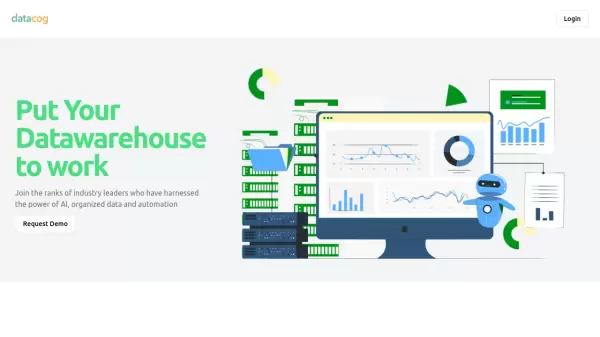 Datacog Put Your Datawarehouse to Work
Datacog is an AI-powered data warehouse management solution that enables organizations to efficiently organize, integrate, and analyze their data assets with zero configuration requirements.
- Contact for Pricing
-
42
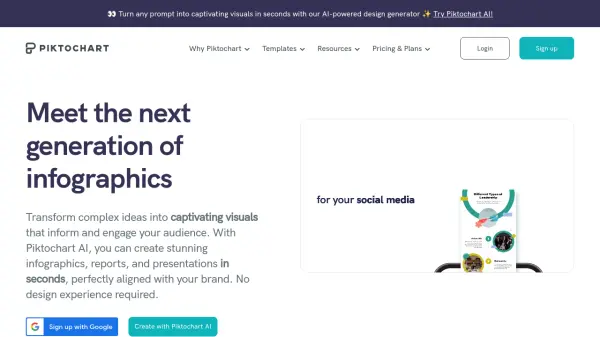 Piktochart Transform complex ideas into captivating visuals in seconds
Piktochart is an AI-powered visual design platform that helps users create professional infographics, presentations, and reports with automated design generation and brand consistency features.
- Freemium
- From 14$
-
43
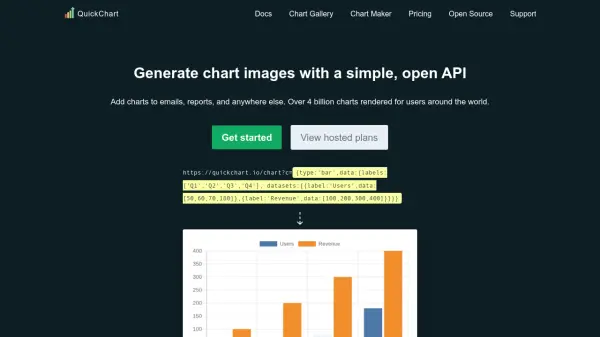 QuickChart Generate Chart Images and QR Codes Instantly via a Flexible API
QuickChart provides a powerful API to dynamically render customizable chart images and QR codes for integration into reports, emails, and applications. Trusted by developers and businesses worldwide, QuickChart supports advanced customization, no-code tools, and open-source flexibility.
- Freemium
- From 40$
-
44
 Paintmaps.com Create Free, Online Map Charts with Your Own Statistical Data, Easily
Paintmaps.com is a free online tool for creating interactive map charts with statistical data visualization, supporting world maps, continent maps, country maps, and more.
- Free
-
45
 Visflow Boost Your Workflow with AI-Powered Flowchart Generation
Visflow allows users to map complex ideas into clear visual flowcharts, incorporating multimedia elements like audio and video for dynamic diagrams. It prioritizes privacy, storing data locally on the user's device.
- Free
-
46
 AnalysAI Say Goodbye To Boring Spreadsheets
AnalysAI is a user-friendly, AI-powered data analysis software that integrates multiple data sources to provide deep insights and predictive analytics for businesses.
- Freemium
- From 29$
-
47
 AI Flowchart Maker Create FlowCharts Easily with AI FlowChart Maker
AI Flowchart Maker is an AI-powered tool that automatically generates professional flowcharts from text or data inputs, simplifying process visualization and workflow mapping.
- Freemium
-
48
 Exploring Data Interactive Data Visualizations with Open Data and Open Source Tools
Exploring Data is a platform showcasing interactive data visualizations created using open data and open source tools, featuring various network graphs, 3D globes, and geographic maps.
- Free
-
49
 AlgForce AI From Excel to Advanced Data Analysis Reports, AI-Powered in One Click!
AlgForce AI transforms Excel data into comprehensive data analysis reports with AI-powered automation. Generate various analytical perspectives and visualizations instantly.
- Free
-
50
 Schema Visualizer Build & visualize your data schemas together
Schema Visualizer is an AI-powered platform that automatically generates visualizations for data schemas in JSON, XML, Proto, GraphQL, Prisma, and other formats, enabling teams to collaborate, document, and synchronize changes with GitHub.
- Freemium
- From 6$
Didn't find tool you were looking for?