ReddRadar

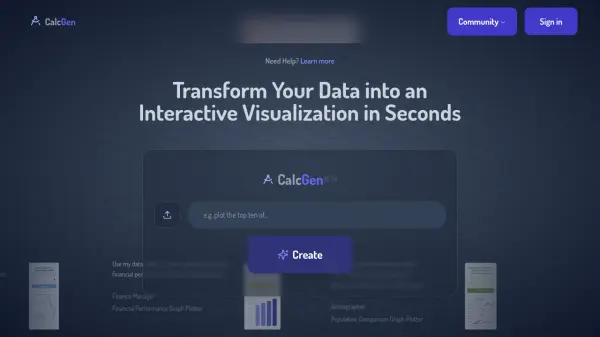
What is CalcGen?
CalcGen allows users to create custom calculators and visualizations. It supports a wide variety of inputs, ranging from simple data tables to complex scientific formulas. The platform enables users to quickly transform raw data or concepts into interactive tools, making data analysis and calculation more accessible and efficient.
CalcGen empowers users across various fields, allowing a finance manager to plot financial performance, a demographer to compare populations, or a scientist to build a calculator for scientific laws. It supports requests for data visualizations and calculator creation across multiple domains.
Features
- Financial Performance Graph Plotter: Create graphs showing financial performance across multiple metrics.
- Population Comparison Graph Plotter: Generate graphs comparing population data.
- Ideal Gas Law Calculator: Build a calculator for the ideal gas law.
- Bernoulli Equation Solver: Create a calculator for the Bernoulli equation.
- Compound Interest Calculator: Develop a calculator for compound interest.
- Roofing Quote Generator: Generates quote estimations based on square footage and material costs.
- Quarterly Financial Calculator: Plots financial data over four quarters, displaying revenue, expenses, and profit.
- Varsity Sports Participation Calculator: Visualizes sports participation by season.
- Fibonacci Sequence Growth Plotter: Creates a plotter for Fibonacci sequence growth.
- Solar Investment Savings Calculator: Plots savings over time based on investment and electricity rates.
- Sharpe Ratio Calculator: Creates a calculator for the Sharpe Ratio.
- Earth-Sun Distance Calculator: Plots the distance between the Earth and the Sun based on a given time interval.
- Highest Worldwide Box Office Films Calculator: Plots highest worldwide box office earnings by release date for films.
- Rental Property ROI Calculator: Determines the ROI of a rental property over time.
- Used Vehicle Price Comparison Graph: Compares 5-year and 10-year used vehicle prices across different models.
- Element Density vs Proton Number Graph: Plots the relationship between element density and proton number.
Use Cases
- Plotting financial performance across multiple metrics.
- Comparing population data between cities.
- Creating a calculator for scientific equations (e.g., Ideal Gas Law, Bernoulli Equation).
- Generating quotes for services (e.g., roofing).
- Visualizing quarterly financial data.
- Analyzing sports participation statistics.
- Plotting mathematical sequences (e.g., Fibonacci).
- Calculating investment savings (e.g., solar energy).
- Calculating financial ratios (e.g., Sharpe Ratio).
- Visualizing astronomical data (e.g., Earth-Sun distance).
- Analyzing film industry data (e.g., box office earnings).
- Determining the return on investment for rental properties.
- Comparing used vehicle prices.
- Plotting scientific data (e.g., element density vs. proton number).