HubSpot data visualization tool - AI tools
-
 InstaCharts Instant Data Visualization and Smart Chart Creation
InstaCharts is an intuitive data visualization tool that uses smart technology to automatically generate interactive charts and tables from your spreadsheet data. Easily create, customize, share, and embed compelling visualizations for reports, websites, and data exploration.
- Freemium
- From 10$
-
 Sheet Alchemy Go From HubSpot Complexity to Clear Insights in 2 Minutes
Sheet Alchemy offers a plug-and-play dashboard connecting HubSpot Deals, Contacts, Companies, and Campaigns, providing clear insights without coding or expert help. Setup takes just 2 minutes for unified data visibility.
- Freemium
- From 12$
-
 SheetBot AI AI-Powered Data Analysis and Visualization Assistant
SheetBot AI is an intelligent data analysis tool that automates data visualization and streamlines complex analytical tasks, helping users create professional graphs and insights instantly.
- Contact for Pricing
-
 xyzt.ai Turn your IoT data into actionable insights
xyzt.ai is a powerful platform that combines spatial and time series analysis to visualize and analyze spatio-temporal data from any source, regardless of size. It specializes in IoT, maritime, and mobility data analytics with GenAI-powered insights.
- Contact for Pricing
-
 My Music Pie Chart Visualize Your Music Habits with Colorful Spotify Pie Charts
My Music Pie Chart is an innovative AI-powered tool that transforms your Spotify listening history into colorful visual pie charts, showcasing your top artists, tracks, and genres without requiring login or storing your data.
- Free
-
 Visual.is Create beautiful and dynamic data visualizations easily
Visual.is is an AI-powered platform that enables users to create professional reports, charts, and dashboards without technical expertise, offering user-friendly tools with beautiful design templates.
- Freemium
- From 8$
-
 Exploring Data Interactive Data Visualizations with Open Data and Open Source Tools
Exploring Data is a platform showcasing interactive data visualizations created using open data and open source tools, featuring various network graphs, 3D globes, and geographic maps.
- Free
-
 Insiderviz AI-powered data visualization platform
Insiderviz is an AI tool for creating interactive data visualizations and insights from complex datasets.
- Other
-
 ChartPixel Automated charts and insights in 30 seconds
ChartPixel is an AI-powered data analysis platform that transforms complex data into clear visualizations and actionable insights without coding. It offers automated data cleaning, statistical analysis, and instant chart generation suitable for both beginners and professionals.
- Freemium
- From 15$
-
 Datacopia Effortless Data Visualization for Everyone
Datacopia enables users to effortlessly generate a wide variety of charts and graphs from their data, streamlining data analysis and visualization tasks.
- Other
-
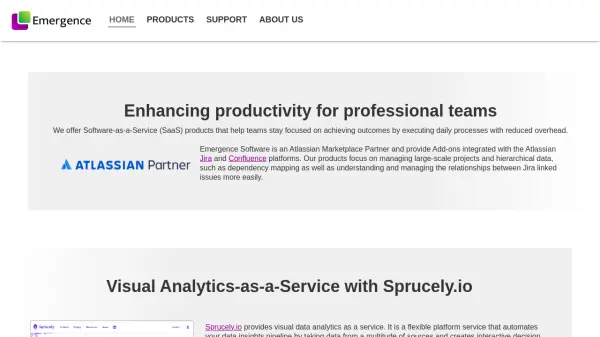 emergence.com.sg Automated Data Insights and Interactive Visual Analytics
Sprucely.io delivers automated visual data analytics, transforming data from multiple sources into interactive dashboards for enhanced decision intelligence.
- Other
-
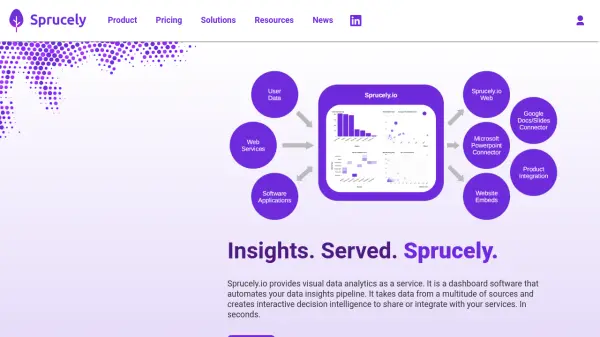 Sprucely.io Visual Data Analytics as a Service for Automated Insights.
Sprucely.io offers visual data analytics as a service, automating the pipeline from data source connection to interactive dashboard creation for actionable insights. It supports cloud and on-premise deployment.
- Freemium
- From 8$
-
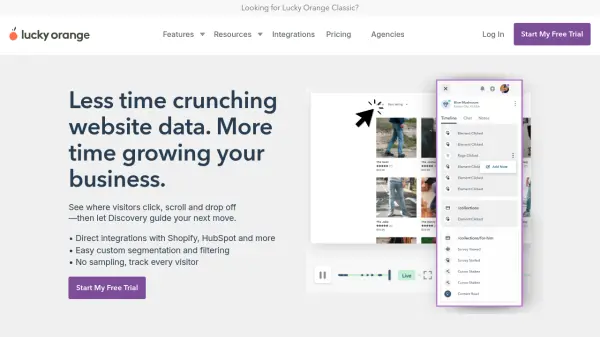 Lucky Orange Less time crunching website data. More time growing your business.
Lucky Orange is an AI-powered website optimization platform that provides heatmaps, session recordings, and AI-driven insights to help businesses understand visitor behavior and improve conversion rates.
- Freemium
- From 32$
-
 Graphy Create pro-level graphs that inspire actions.
Graphy simplifies data presentation and communication, enabling anyone to become a skilled data storyteller. Its AI-powered features create actionable insights and drive faster decisions.
- Freemium
- From 8$
-
 welcome.calcgen.ai Build Beautiful, Interactive, Customizable Data Visuals in Seconds
CalcGen uses a swarm of AI agents to automatically research, analyze, and create interactive, customizable data visualizations from a single prompt.
- Paid
- From 10$
-
 FusionCharts Build interactive, responsive, and beautiful JavaScript charts for any framework
FusionCharts provides high-performance JavaScript charting libraries for creating interactive, responsive charts and dashboards across frameworks like React, Vue, Angular, and pure JavaScript, trusted by over 800,000 developers.
- Free Trial
-
 Elusidate Turn data into reports in 1 click
Elusidate is an AI-powered data analysis and visualization tool that transforms raw data into comprehensive reports, charts, and presentations instantly.
- Freemium
- From 4$
-
 SirPlotsAlot Data Insights in Seconds
SirPlotsAlot is an AI-powered tool that enables users to chat with their data, generating expert-level insights and visualizations instantly for quick analysis.
- Freemium
- From 10$
-
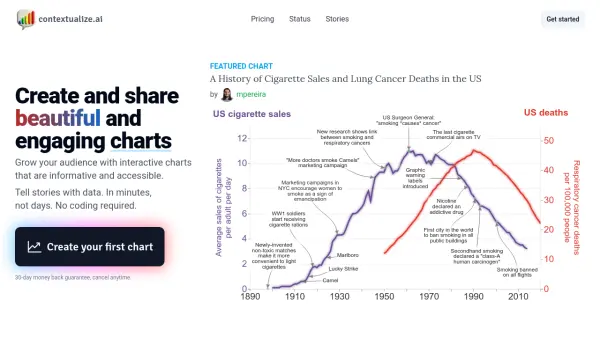 contextualize.ai Tell stories with data. In minutes, not days. No coding required.
Contextualize.ai enables users to create and share interactive, annotated charts to tell compelling stories with data quickly and without coding, featuring AI-powered insights.
- Freemium
- From 19$
-
 ImgCharts Free Chart Maker for Amazing Visualizations
ImgCharts is a free online chart maker that enables users to create various types of charts instantly without requiring sign-up, offering a user-friendly interface for data visualization.
- Free
-
 Vizly Your AI-powered data analyst
Vizly is an AI-powered data analysis tool that allows users to chat with their files and uncover valuable insights using powerful AI models. Analyze data, create visualizations, and generate reports in seconds.
- Freemium
- From 20$
-
 VisioChart Transforming complex data into interactive visual formats.
VisioChart offers a diverse range of Power BI visualizations to transform complex data into interactive visual formats, enabling users to create engaging charts without coding or design skills.
- Contact for Pricing
-
 haystack.design Unlimited Custom Data Visualizations on Demand
Haystack offers a subscription-based service for unlimited custom data visualizations, including charts, graphs, maps, and infographics, tailored to your specific needs. Streamline your data storytelling with rapid turnaround, expert design, and unlimited revisions.
- Paid
- From 2995$
-
 Brainsight Sharp Creative. Instant Attention
Brainsight uses AI to predict audience attention on visual designs like ads, websites, and videos, providing instant heatmaps and insights to optimize creative impact before launch.
- Free Trial
- From 248$
-
 ApexCharts Modern & Interactive Open-source Charts for Developers
ApexCharts is an open-source charting library that enables developers to create beautiful, interactive data visualizations for web applications with extensive API documentation and multiple chart types.
- Freemium
- From 17$
-
 SnappyCharts Create stunning charts in minutes with no coding required
SnappyCharts is a no-code, web-based solution that transforms data into beautiful, responsive charts quickly and easily.
- Freemium
- From 10$
-
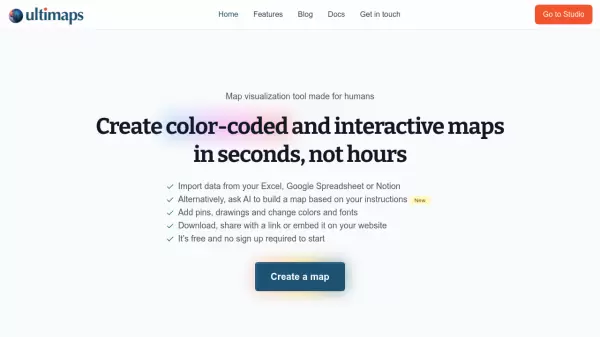 Ultimaps Map visualization tool made for humans
Ultimaps is an intuitive map visualization platform that allows users to create color-coded and interactive maps instantly by importing data from Excel, Google Spreadsheet, or Notion, with AI-assisted map creation capabilities.
- Freemium
- From 17$
-
 gistapp.com Create engaging, connective microsites from your structured data
Gist is an AI-powered data visualization platform that transforms structured data into interactive microsites, enabling businesses, museums, and researchers to share insights through intuitive visualizations and collaborative tools.
- Other
-
 My Little Chart Rapid, Beautiful Chart Creation with Real-Time Data Sync
My Little Chart enables analysts and creatives to swiftly generate customizable, visually engaging charts and graphs, synchronizing data in real time for impactful presentations and seamless integration. Enjoy easy data imports, broad personalization, and effortless embedding across modern platforms.
- Freemium
- From 2$
-
 Datawrapper Create better charts, maps, and tables with ease
Datawrapper is a powerful web application that enables users to design and publish high-quality data visualizations, including charts, maps, and tables, with professional and accessible results.
- Freemium
- From 599$
Featured Tools
Join Our Newsletter
Stay updated with the latest AI tools, news, and offers by subscribing to our weekly newsletter.
Explore More
-
AI training platform 34 tools
-
AI tattoo design tool 35 tools
-
AI for sports performance 15 tools
-
US bank statement processing tool 10 tools
-
OCR for invoices to Excel 10 tools
-
ai malware protection tool 25 tools
-
AI-ready data extraction tool 43 tools
-
AI customer data platform for businesses 46 tools
-
vocabulary enhancement tool for academics 22 tools
Didn't find tool you were looking for?