ReddRadar

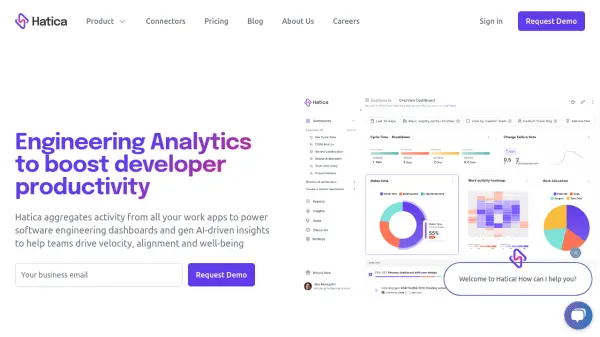
What is Hatica?
Hatica offers a comprehensive engineering analytics solution designed to enhance developer productivity and team performance. By integrating with various work applications like Git, project management, CI/CD, communication, and incident management tools, it aggregates activity data to provide a holistic view of engineering workflows. This platform delivers software engineering dashboards and utilizes generative AI to produce actionable insights, enabling teams to make data-driven decisions.
The platform focuses on key areas such as software delivery lifecycle (SDLC) velocity, alignment with business objectives, and developer well-being. It provides detailed metrics including Cycle Time, DORA metrics (Deployment Frequency, Lead Time for Changes, Mean Time to Restore, Change Failure Rate), code review statistics, and maker time analysis. These insights help identify bottlenecks, measure DevOps performance, understand collaboration patterns, track project health, monitor investment allocation, and improve planning accuracy, ultimately fostering a culture of continuous improvement and sustainable productivity within engineering organizations.
Features
- Cycle time metrics: Track PR stages from coding to deployment to identify bottlenecks and improve SDLC velocity.
- DORA metrics: Measure DevOps performance including Deployment frequency, MTTR, Change failure rate, and Lead time.
- Code review metrics: Analyze metrics like Unreviewed PRs merged and PR size for code review quality.
- Work Insights: Aggregate work activity across tools and run automated async stand-ups via Slack, Email, or app.
- Collaboration insights: Measure maker time, quiet days, and meeting patterns to understand team collaboration and well-being.
- Project Health Dashboard: View project, engineering, and sprint metrics in a simplified view.
- Investment Allocation Tracking: Understand time spent by engineers and align efforts with business goals.
- Planning Accuracy Measurement: Compare planned work versus completed work per sprint.
Use Cases
- Improving software delivery velocity by identifying and removing SDLC bottlenecks.
- Enhancing sprint planning and delivery accuracy.
- Increasing developer focus time (Maker time) and improving well-being.
- Aligning engineering team efforts with strategic business objectives.
- Measuring and improving DevOps performance using DORA metrics.
- Gaining visibility into code review processes and collaboration quality.
- Facilitating asynchronous communication and progress tracking with automated stand-ups.
- Making data-driven decisions for resource allocation and process improvements.
- Monitoring team workload and preventing burnout through well-being metrics.
FAQs
-
Who is a member in Hatica?
The pricing page implies a member is an individual user within the engineering team whose data is analyzed, likely developers or engineers actively contributing to projects tracked by the platform. -
Can I control how many members get billed in my team or company?
While not explicitly detailed in the provided text, subscription models are typically based on the number of active members utilizing the platform's features, suggesting control is likely possible through user management within the Hatica account settings. -
Is my data secure?
Hatica emphasizes 'Privacy by design' and 'Robust security' as product highlights, indicating a focus on data security, though specific measures are not detailed in the provided text. -
What payment methods do you accept?
Specific payment methods accepted are not mentioned in the provided content. -
Do you have on-premises/self-hosting option?
Yes, an on-premises/self-hosting option ('Low maintenance on-prem hosting available') is mentioned as a product highlight and is included in the Enterprise plan ('Self-hosted/Private cloud').