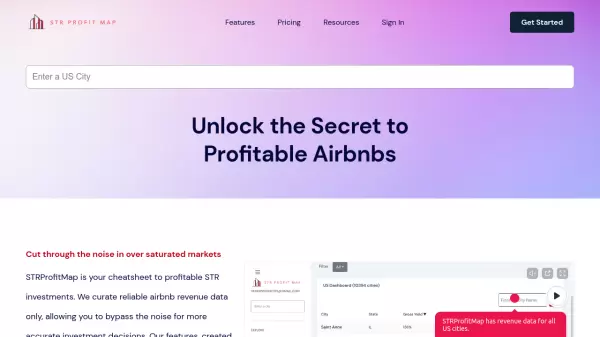
What is STRProfitMap?
STRProfitMap serves as an essential tool for short-term rental investors, providing curated and reliable Airbnb revenue data to facilitate informed investment decisions. The platform combines STR revenue data, market trends, and specific heuristics to deliver accurate analytics and interactive visualizations.
The platform offers comprehensive market analysis for all US cities, featuring detailed analytics, interactive profit maps, and AI-powered buy boxes that analyze guest reviews to identify revenue-driving amenities. With weekly revenue updates and monthly property valuations, STRProfitMap ensures investors have access to current and accurate market data.
Features
- In-depth Analytics: Comprehensive revenue analytics and profit maps using STR data and market trends
- Profit Maps: Interactive visualization of market profitability for data-driven decisions
- Country Explorer: State-level performance insights with occupancy rates and revenue trends
- Buy Boxes: AI-powered amenity analysis from top-performing property reviews
- Market Coverage: Analysis for over 11,000 US cities and markets
- Data Updates: Weekly revenue updates and monthly property valuations
- Export Capability: Data export to spreadsheet functionality
Use Cases
- Identifying profitable Airbnb investment markets
- Analyzing market performance and trends
- Comparing different states and cities for investment potential
- Evaluating property ROI potential
- Determining optimal amenities for revenue generation
- Market research for property portfolio expansion
FAQs
-
Where does the data come from?
The revenue, occupancy rates, and average daily rates are sourced from Airbnb and VRBO. Property valuation data comes from a 3rd party resource using addresses of active short-term rentals. Revenue and occupancy data are updated weekly, and property values monthly. -
What defines a reliable listing on STRProfitMap?
A reliable listing is an STR with at least a year of operation, consistent reviews, and regular bookings. These properties are selected to ensure the data reflects a proven track record of performance and accurate revenue potential. -
Is there a free trial or demo available?
Yes, users can access a free trial that includes state dashboard comparing different markets. Full access to city detailed analytics requires a premium subscription. -
What does the revenue percentile mean?
The revenue percentile metric shows property performance within revenue ranges: Bottom 25% (Lowest Earners), Median (Middle Earners), Top 25% (Mid-High Earners), and Top 10% (High Earners).
Related Queries
Helpful for people in the following professions
STRProfitMap Uptime Monitor
Average Uptime
99.86%
Average Response Time
140 ms
Featured Tools
Join Our Newsletter
Stay updated with the latest AI tools, news, and offers by subscribing to our weekly newsletter.


