
FusionCharts - Alternatives & Competitors
Build interactive, responsive, and beautiful JavaScript charts for any framework
FusionCharts provides high-performance JavaScript charting libraries for creating interactive, responsive charts and dashboards across frameworks like React, Vue, Angular, and pure JavaScript, trusted by over 800,000 developers.

Ranked by Relevance
-
1
 ApexCharts Modern & Interactive Open-source Charts for Developers
ApexCharts is an open-source charting library that enables developers to create beautiful, interactive data visualizations for web applications with extensive API documentation and multiple chart types.
- Freemium
- From 17$
-
2
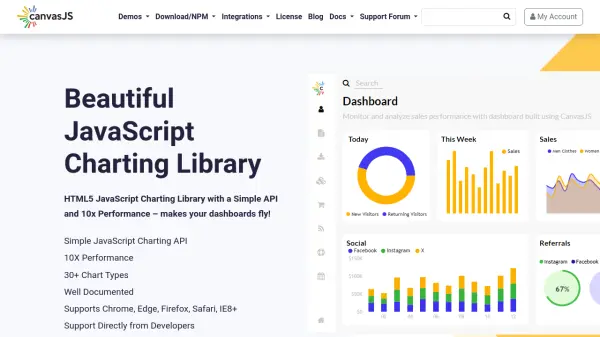 CanvasJS High-Performance JavaScript Charting Library
CanvasJS is a robust JavaScript charting library that enables users to create fast, visually appealing HTML5 charts and dashboards across all major libraries and frameworks.
- Paid
-
3
 Chartworks Complex financial data made beautiful. Everywhere.
Chartworks provides interactive HTML5 charts, image-based charts, and mobile SDKs for visualizing complex financial data across web, mobile, and various platforms with responsive design and easy integration.
- Contact for Pricing
-
4
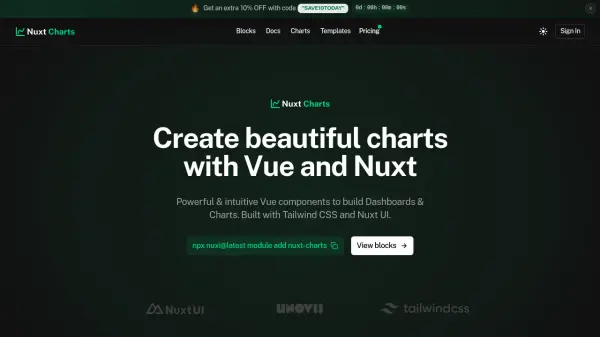 Nuxt Charts Powerful & intuitive Vue components to build Dashboards & Charts.
Nuxt Charts offers advanced and customizable Vue components for creating professional dashboards and data visualizations, seamlessly integrating with Nuxt UI and Tailwind CSS.
- Pay Once
-
5
 MakeCharts Visualize Complexity into Clarity
MakeCharts is an AI-powered visualization tool that transforms data, ideas, and plans into clear, shareable visuals including charts, diagrams, timelines, and frameworks in minutes.
- Freemium
- From 7$
-
6
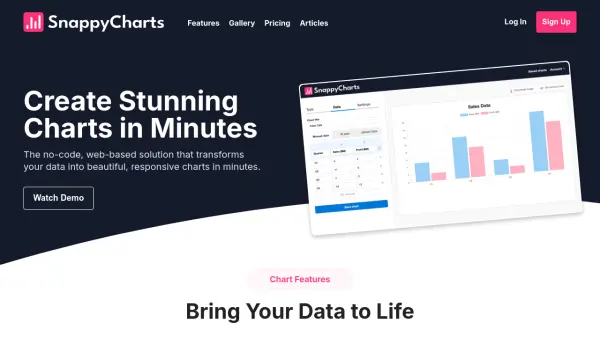 SnappyCharts Create stunning charts in minutes with no coding required
SnappyCharts is a no-code, web-based solution that transforms data into beautiful, responsive charts quickly and easily.
- Freemium
- From 10$
-
7
 ImgCharts Free Chart Maker for Amazing Visualizations
ImgCharts is a free online chart maker that enables users to create various types of charts instantly without requiring sign-up, offering a user-friendly interface for data visualization.
- Free
-
8
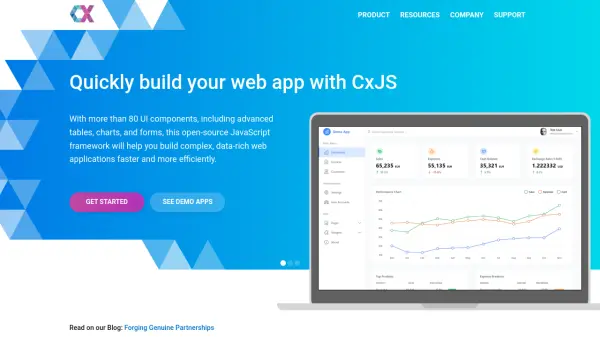 CxJS Build Complex Web Apps Quickly with a Powerful JavaScript UI Framework
CxJS is an open-source JavaScript framework designed to accelerate the development of complex, data-rich web applications with over 80 UI components, including advanced charts, tables, and forms.
- Free
-
9
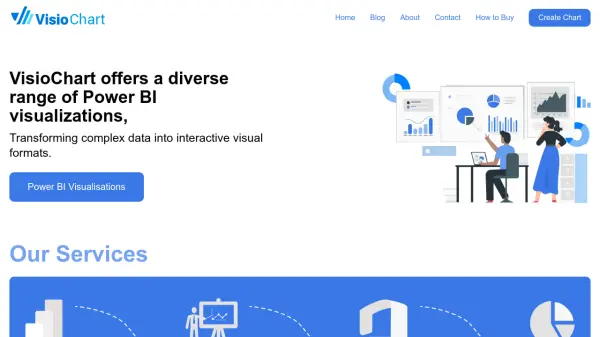 VisioChart Transforming complex data into interactive visual formats.
VisioChart offers a diverse range of Power BI visualizations to transform complex data into interactive visual formats, enabling users to create engaging charts without coding or design skills.
- Contact for Pricing
-
10
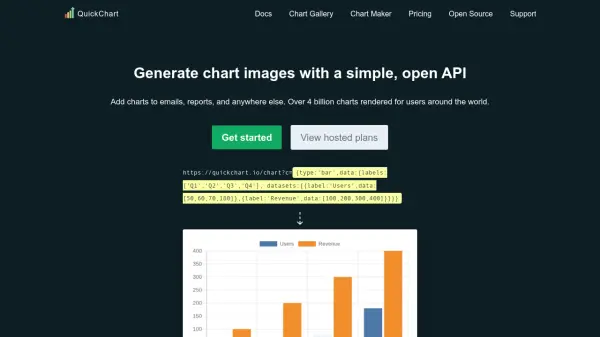 QuickChart Generate Chart Images and QR Codes Instantly via a Flexible API
QuickChart provides a powerful API to dynamically render customizable chart images and QR codes for integration into reports, emails, and applications. Trusted by developers and businesses worldwide, QuickChart supports advanced customization, no-code tools, and open-source flexibility.
- Freemium
- From 40$
-
11
 InstaCharts Instant Data Visualization and Smart Chart Creation
InstaCharts is an intuitive data visualization tool that uses smart technology to automatically generate interactive charts and tables from your spreadsheet data. Easily create, customize, share, and embed compelling visualizations for reports, websites, and data exploration.
- Freemium
- From 10$
-
12
 Visual.is Create beautiful and dynamic data visualizations easily
Visual.is is an AI-powered platform that enables users to create professional reports, charts, and dashboards without technical expertise, offering user-friendly tools with beautiful design templates.
- Freemium
- From 8$
-
13
 My Little Chart Rapid, Beautiful Chart Creation with Real-Time Data Sync
My Little Chart enables analysts and creatives to swiftly generate customizable, visually engaging charts and graphs, synchronizing data in real time for impactful presentations and seamless integration. Enjoy easy data imports, broad personalization, and effortless embedding across modern platforms.
- Freemium
- From 2$
-
14
 Lovely Charts Create professional diagrams for your website with ease
Lovely Charts helps users create various types of professional diagrams including flowcharts, sitemaps, business processes, organization charts, and wireframes for website integration.
- Other
-
15
 Datawrapper Create better charts, maps, and tables with ease
Datawrapper is a powerful web application that enables users to design and publish high-quality data visualizations, including charts, maps, and tables, with professional and accessible results.
- Freemium
- From 599$
-
16
 JointJS+ JavaScript diagramming library powering exceptional UIs
JointJS+ is a professional JavaScript diagramming library that enables developers to build AI-powered visual and no-code applications with scalable vector graphics, extensive customization, and framework compatibility.
- Pay Once
-
17
 AI Dashboard Design Design your Dashboard with AI
AI Dashboard Design uses artificial intelligence to help users create visually stunning and informative dashboards quickly with a drag-and-drop builder and AI-generated charts.
- Freemium
-
18
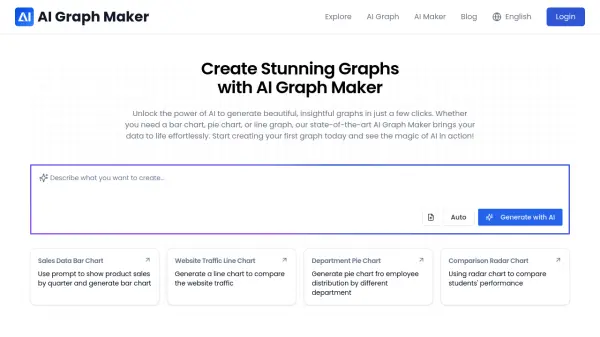 AI Graph Maker Create Stunning Graphs with AI
AI Graph Maker uses AI to generate various types of insightful graphs, including bar charts, pie charts, and line graphs. Start creating data visualizations effortlessly.
- Free
-
19
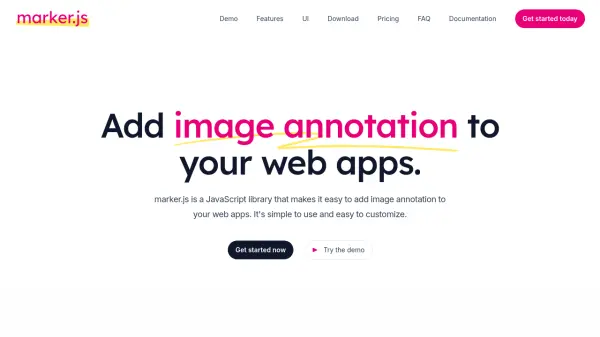 marker.js Seamless Image Annotation for Web Apps
marker.js is a JavaScript library that enables easy image annotation within web apps, offering customizable components and compatibility with any modern framework. Ideal for developers seeking flexible, interactive visual feedback tools.
- Freemium
Didn't find tool you were looking for?