 ReddRadar
Top AI tools for interactive charts
-
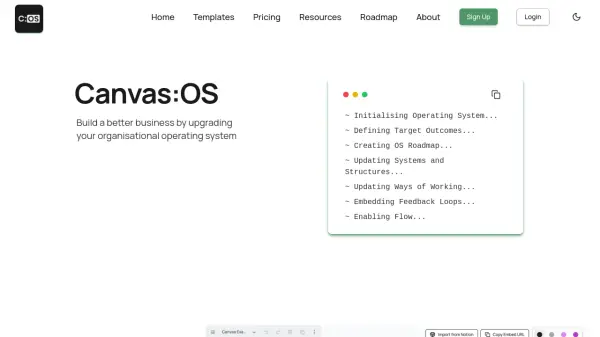 Canvas:OS Upgrade Your Business with AI-Augmented Collaboration and Content Tools
Canvas:OS is an AI-powered organizational platform offering collaborative tools, chart creation, workflow mapping, and an AI-augmented text editor for enhanced business productivity.
- Freemium
-
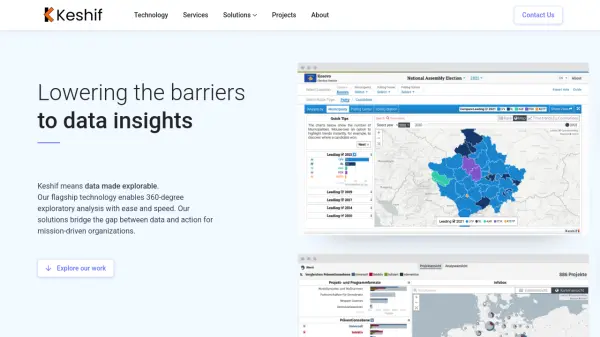 Keshif Data made explorable with 360-degree exploratory analysis
Keshif is an AI-powered visual data analytics platform that transforms tables and databases into interactive dashboards and charts for rapid exploratory analysis.
- Contact for Pricing
-
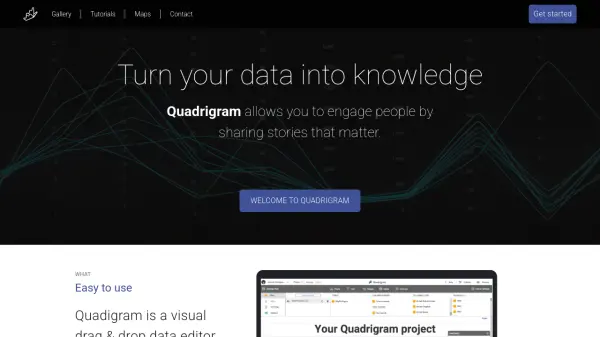 Quadrigram Turn your data into knowledge with interactive visualizations
Quadrigram is a visual drag-and-drop data editor that transforms data into engaging stories through interactive visualizations, combining texts, images, and charts without coding skills.
- Freemium
- From 20$
-
 Windrush.io Your Gateway to Crypto Insights and Data Innovation
Windrush.io provides crypto insights and data-driven solutions with secure cloud storage and interactive data visualization tools for the digital economy.
- Other
-
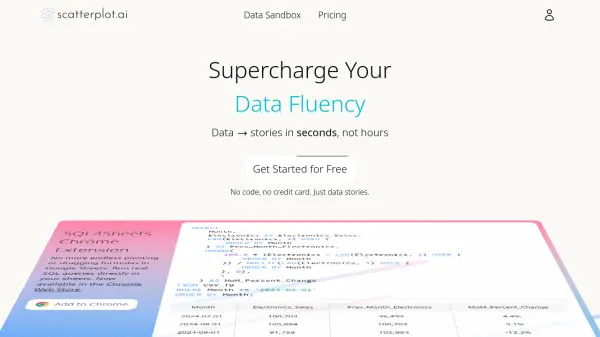 Scatterplot.ai Data stories in seconds, not hours
Scatterplot.ai is an AI-powered data analysis platform that automates forecasting, key driver analysis, visualization, and data storytelling with no-code functionality for business decision-making.
- Freemium
-
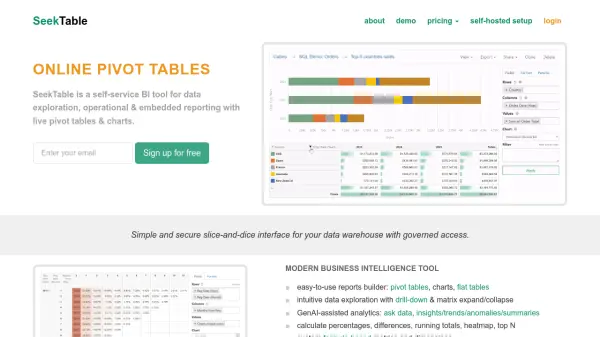 SeekTable Self-service BI tool for data exploration and operational reporting with live pivot tables and charts.
SeekTable is a modern business intelligence platform offering self-service data exploration, operational reporting, and embedded analytics with AI-assisted features for enhanced insights.
- Freemium
-
 Chartworks Complex financial data made beautiful. Everywhere.
Chartworks provides interactive HTML5 charts, image-based charts, and mobile SDKs for visualizing complex financial data across web, mobile, and various platforms with responsive design and easy integration.
- Contact for Pricing
-
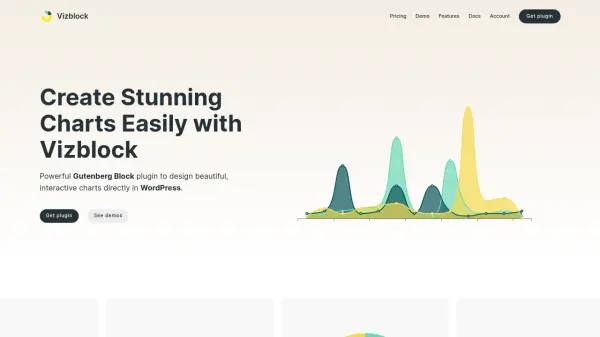 Vizblock Powerful Gutenberg Block plugin to design beautiful, interactive charts directly in WordPress
Vizblock is a WordPress Gutenberg block plugin that enables users to create stunning, interactive charts with an intuitive drag-and-drop interface, no coding required.
- Pay Once
-
 ApexCharts Modern & Interactive Open-source Charts for Developers
ApexCharts is an open-source charting library that enables developers to create beautiful, interactive data visualizations for web applications with extensive API documentation and multiple chart types.
- Freemium
- From 17$
-
 Preev Real-time cryptocurrency converter with live price streaming
Preev is a real-time cryptocurrency converter that provides instant conversions between 150+ cryptocurrencies and 150+ fiat currencies with live price streaming from major exchanges.
- Free
-
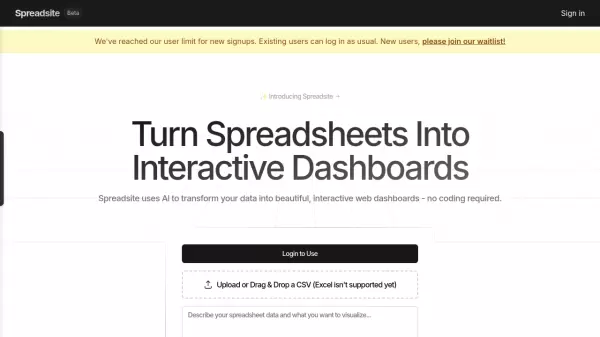 Spreadsite Turn Spreadsheets Into Interactive Dashboards
Spreadsite is an AI-powered tool that transforms spreadsheet data into beautiful, interactive web dashboards without requiring any coding skills.
- Freemium
-
 IcebergSearch Generate Deep-Dive Iceberg Charts on Any Topic Instantly
IcebergSearch uses artificial intelligence to generate interactive iceberg charts for any subject, visualizing knowledge from surface-level facts to deeper, hidden insights.
- Free
-
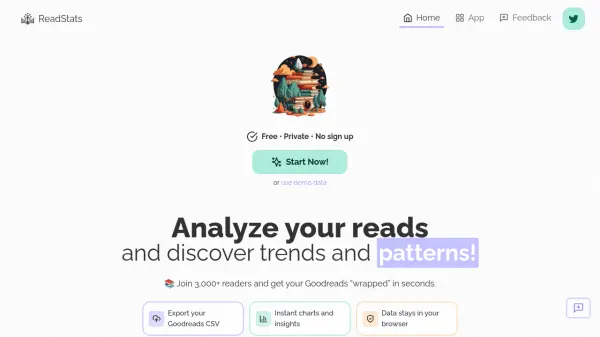 ReadStats Visualize, analyze, and discover insights from your Goodreads reading data.
ReadStats provides instant charts and analytics for Goodreads users, enabling private exploration of individual reading habits, trends, and patterns with ease.
- Free
-
 Open Stock Alert Empowering Investors with AI-Driven Stock Analysis and Predictions
Open Stock Alert leverages machine learning and data mining to provide advanced stock market analysis, personalized watchlists, and AI-powered trading signal predictions, ideal for investors seeking data-driven insights.
- Free
-
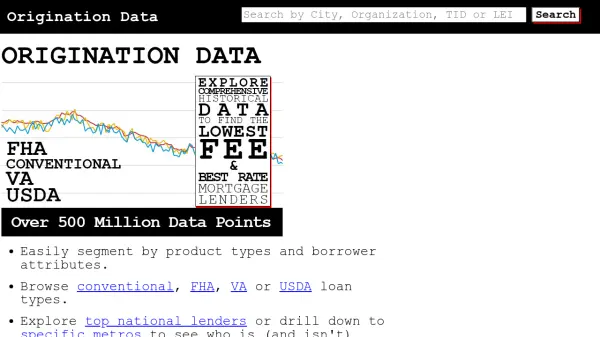 Origination Data Comprehensive Insights into Mortgage Lender Performance
Origination Data delivers an objective and comprehensive view of mortgage lenders, enabling users to analyze loan products, borrower attributes, lender fees, and performance across US markets through interactive data visualizations.
- Other
-
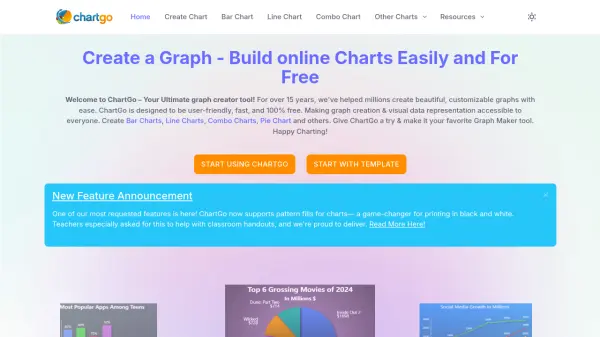 ChartGo Create Professional Charts Online for Free
ChartGo is a free online tool designed to help users easily create, customize, and export a wide range of chart types, making data visualization accessible for everyone.
- Free
-
 InstaCharts Instant Data Visualization and Smart Chart Creation
InstaCharts is an intuitive data visualization tool that uses smart technology to automatically generate interactive charts and tables from your spreadsheet data. Easily create, customize, share, and embed compelling visualizations for reports, websites, and data exploration.
- Freemium
- From 10$
-
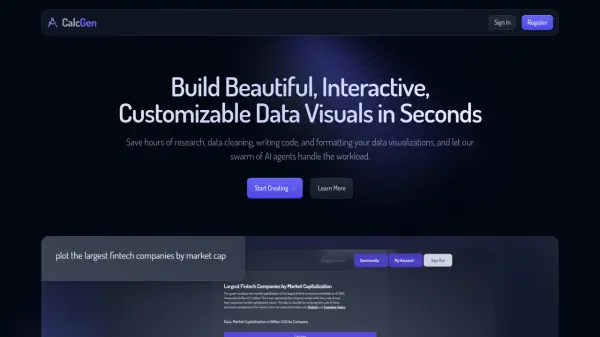 welcome.calcgen.ai Build Beautiful, Interactive, Customizable Data Visuals in Seconds
CalcGen uses a swarm of AI agents to automatically research, analyze, and create interactive, customizable data visualizations from a single prompt.
- Paid
- From 10$
-
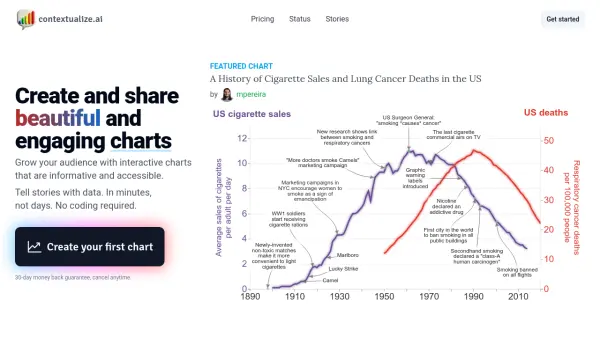 contextualize.ai Tell stories with data. In minutes, not days. No coding required.
Contextualize.ai enables users to create and share interactive, annotated charts to tell compelling stories with data quickly and without coding, featuring AI-powered insights.
- Freemium
- From 19$
Explore More Tags
-
compliance tools 77 tools
-
GDPR 57 tools
-
legal research 48 tools
-
productivity 231 tools
-
document interaction 31 tools
-
content analysis 116 tools
-
audio transcription 71 tools
-
video transcription 81 tools
-
meeting minutes 20 tools
Didn't find tool you were looking for?