 ReddRadar
visual data presentation tool - AI tools
-
 Visual.is Create beautiful and dynamic data visualizations easily
Visual.is is an AI-powered platform that enables users to create professional reports, charts, and dashboards without technical expertise, offering user-friendly tools with beautiful design templates.
- Freemium
- From 8$
-
 Exploring Data Interactive Data Visualizations with Open Data and Open Source Tools
Exploring Data is a platform showcasing interactive data visualizations created using open data and open source tools, featuring various network graphs, 3D globes, and geographic maps.
- Free
-
 Datacopia Effortless Data Visualization for Everyone
Datacopia enables users to effortlessly generate a wide variety of charts and graphs from their data, streamlining data analysis and visualization tasks.
- Other
-
 emergence.com.sg Automated Data Insights and Interactive Visual Analytics
Sprucely.io delivers automated visual data analytics, transforming data from multiple sources into interactive dashboards for enhanced decision intelligence.
- Other
-
 Quadrigram Turn your data into knowledge with interactive visualizations
Quadrigram is a visual drag-and-drop data editor that transforms data into engaging stories through interactive visualizations, combining texts, images, and charts without coding skills.
- Freemium
- From 20$
-
 Elusidate Turn data into reports in 1 click
Elusidate is an AI-powered data analysis and visualization tool that transforms raw data into comprehensive reports, charts, and presentations instantly.
- Freemium
- From 4$
-
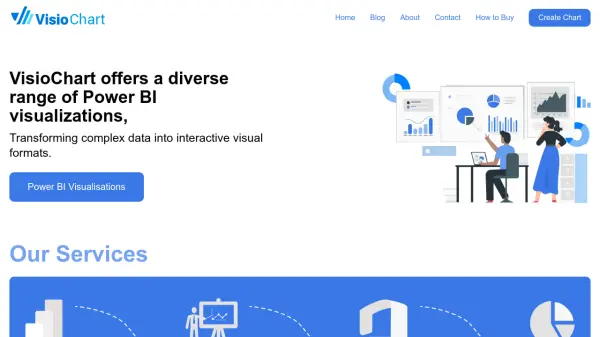 VisioChart Transforming complex data into interactive visual formats.
VisioChart offers a diverse range of Power BI visualizations to transform complex data into interactive visual formats, enabling users to create engaging charts without coding or design skills.
- Contact for Pricing
-
 Presenton.ai Turn Boring Data to Engaging Presentations
Presenton.ai is an AI-powered presentation tool that transforms complex data, reports, and insights into visually engaging, interactive presentations in just a few clicks.
- Freemium
- From 10$
-
 Bin Data to dashboards in seconds.
Bin is an AI business intelligence analyst that transforms complex data into stunning visualizations and interactive dashboards using natural language descriptions, eliminating the need for manual SQL queries or complex BI tools.
- Paid
- From 25$
-
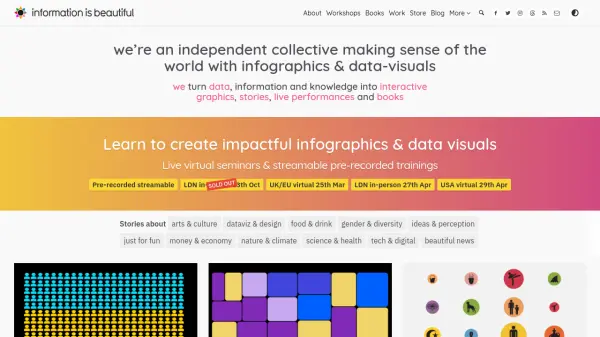 Information is Beautiful Making sense of the world with infographics and data-visuals
Information is Beautiful is an independent collective that transforms complex data, information, and knowledge into interactive graphics, stories, live performances, and books to help people understand the world.
- Other
-
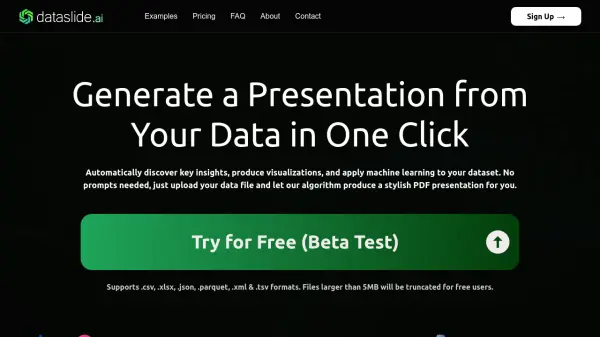 Dataslide AI Generate a Presentation from Your Data in One Click
Dataslide AI is an automated data analysis tool that transforms raw data files into comprehensive PDF presentations with visualizations and machine learning insights, requiring no manual prompts.
- Freemium
- From 20$
-
 Avanzai Talk Data, See Charts
Avanzai is an AI-powered data visualization platform that transforms complex market analysis into interactive charts through natural language processing, supporting both built-in financial data and custom datasets.
- Contact for Pricing
-
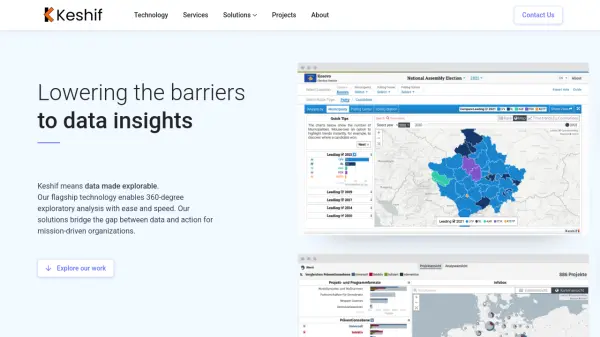 Keshif Data made explorable with 360-degree exploratory analysis
Keshif is an AI-powered visual data analytics platform that transforms tables and databases into interactive dashboards and charts for rapid exploratory analysis.
- Contact for Pricing
-
 welcome.calcgen.ai Build Beautiful, Interactive, Customizable Data Visuals in Seconds
CalcGen uses a swarm of AI agents to automatically research, analyze, and create interactive, customizable data visualizations from a single prompt.
- Paid
- From 10$
-
 ChartPixel Automated charts and insights in 30 seconds
ChartPixel is an AI-powered data analysis platform that transforms complex data into clear visualizations and actionable insights without coding. It offers automated data cleaning, statistical analysis, and instant chart generation suitable for both beginners and professionals.
- Freemium
- From 15$
-
 Datawrapper Create better charts, maps, and tables with ease
Datawrapper is a powerful web application that enables users to design and publish high-quality data visualizations, including charts, maps, and tables, with professional and accessible results.
- Freemium
- From 599$
-
 Line.do Create Infographics and Reports Online
Line.do is an online platform for creating infographics and reports, offering tools for visual communication and diagram generation.
- Other
Featured Tools
Join Our Newsletter
Stay updated with the latest AI tools, news, and offers by subscribing to our weekly newsletter.
Explore More
-
AI-powered internal knowledge base 32 tools
-
multichannel customer support solution 21 tools
-
Marketing product demo creator 16 tools
-
enterprise AI data structuring services 29 tools
-
live chat lead conversion tool 36 tools
-
AI-powered trade data analytics 17 tools
-
GST billing software for small business 11 tools
-
AI tool market research platform 60 tools
-
market forecasting tools for business 19 tools
Didn't find tool you were looking for?