ReddRadar

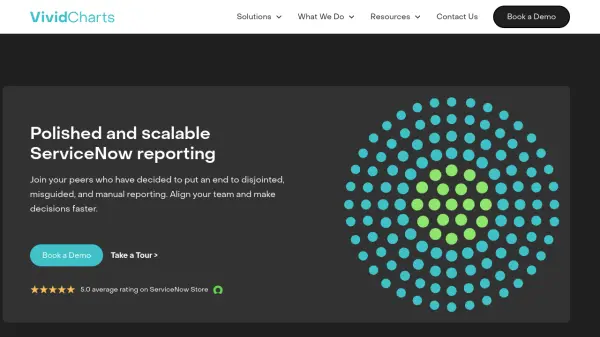
What is VividCharts?
VividCharts is a specialized reporting platform designed to transform ServiceNow data into polished, automated reports and presentations. Installed directly within ServiceNow instances, it connects directly to organizational data to create report and presentation templates that eliminate manual work. The platform features a slide deck-like editor, filterable slide decks, advanced data-mapping capabilities, and true-to-form PowerPoint export functionality.
The technology enables organizations to standardize ServiceNow project reporting, streamline incident KPI reviews, automate management business reviews, and ensure program alignment. With certified products available on the ServiceNow Store and a team of certified developers, VividCharts serves as a trusted partner for enterprises seeking to maximize their ServiceNow environment's potential through automated reporting solutions.
Features
- ServiceNow Integration: Installed directly in ServiceNow instances and tied directly to organizational data
- Template Creation: Create report and presentation templates to eliminate manual reporting work
- Presentation Editor: Slide deck-like editor with filterable slide decks and true-to-form PPT export
- Data Mapping: Advanced data-mapping capabilities for customized reporting
- Automated Reporting: Automates generation of reports and slide decks to save manual hours
Use Cases
- Standardizing ServiceNow project reporting and status updates
- Streamlining incident KPI reviews from ServiceNow data
- Automating management business reviews and quarterly business reviews
- Ensuring program alignment across multiple projects
- Creating branded, visually pleasing reports from ServiceNow data