ReddRadar

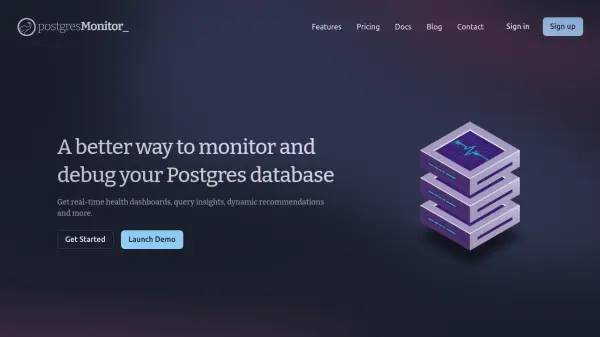
What is Postgres Monitor?
Postgres Monitor is an AI-powered monitoring and debugging tool designed specifically for PostgreSQL databases. It offers comprehensive real-time health dashboards that visualize critical metrics such as server load, memory usage, disk I/O, and replication lag. The platform automatically generates EXPLAIN plans for slow queries, identifies performance bottlenecks, and provides actionable recommendations to improve database efficiency.
The tool includes features like table and index schema monitoring, historical query statistics from pg_stat_statements, and smart alerts that notify users of potential issues before they impact production. With built-in data scrubbing for sensitive information and support for multiple alert channels like Slack and PagerDuty, Postgres Monitor ensures secure and proactive database management for teams of all sizes.
Features
- Real-time Health Dashboards: Pre-built dashboards for connections, PgBouncer, cache, tables, and indexes with server health metrics
- Query Insights: Automatic EXPLAIN plans for slow queries, identification of top queries by time, calls, and disk I/O
- Dynamic Recommendations: Automated detection of disk space savings and performance improvements with clear explanations
- Schema Monitoring: Track table and index schemas, bloat, scans, and cache hit percentages with visual comparisons
- Smart Alerts: Customizable alerts for common issues via Slack, PagerDuty, email, or webhook to detect problems early
Use Cases
- Monitoring PostgreSQL database health and performance in real-time
- Debugging slow queries and optimizing database performance
- Identifying and removing unused indexes to save disk space
- Tracking replication lag and ensuring replica health
- Receiving proactive alerts for database issues before they affect users
FAQs
-
What types of alerts does Postgres Monitor support?
Postgres Monitor supports alerts via Slack, PagerDuty, email, or webhook for monitoring common database issues and custom metrics. -
How does Postgres Monitor handle sensitive data in queries?
Postgres Monitor automatically scrubs and redacts PII and other sensitive data from query insights to ensure security. -
What is included in the Startup Plan?
The Startup Plan includes monitoring for 1 server, 30-day data retention, server health dashboards, dynamic recommendations, query stats, slow queries with EXPLAIN plans, and table/index schema monitoring. -
Can Postgres Monitor track replication lag?
Yes, Postgres Monitor tracks replica health and replication lag metrics as part of its monitoring features. -
How long does it take to get started with Postgres Monitor?
Users can get started in just a few minutes by signing up and launching a demo.