What is OWOX BI?
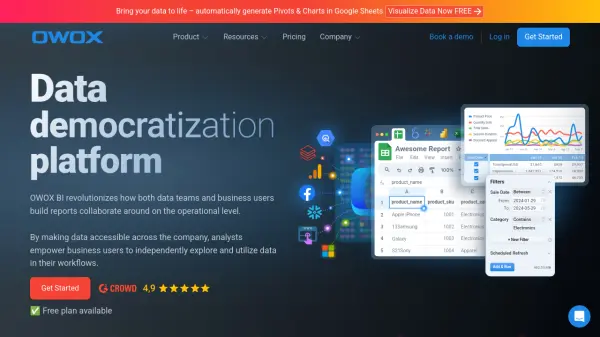
OWOX BI facilitates data accessibility and collaboration across organizations, enabling both data teams and business users to work effectively with operational data. The platform allows connection to core data sources like Google BigQuery and Snowflake, along with spreadsheet data, streamlining the data modeling process with industry-specific templates. Users can build and share data marts, allowing business teams to run, visualize, and customize reports directly within familiar spreadsheet environments like Google Sheets, without needing direct data team intervention for every query.
The system promotes self-service analytics by providing tailored access levels and automating report generation, visualization, and scheduling. It features AI capabilities, such as an SQL Copilot for faster query building and automatic generation of charts and pivots from tabular data. OWOX BI emphasizes data ownership, aims to create a single source of truth, reduces reporting time significantly, cuts data processing costs through smart scheduling, and increases overall data utilization within the company by making corporate data more accessible and actionable for decision-making.
Features
- BigQuery Reports Extension: Simplify getting reports from BigQuery in Google Sheets.
- Auto-Generated Charts & Pivots: Quickly turn Google Sheets data into dynamic dashboards.
- Data Preparation (SQL, No SQL): Handle data modeling and preparation efficiently.
- SQL Copilot: Build SQL queries significantly faster using AI.
- Data Connectors: Integrate data from various sources including BigQuery, Snowflake, ad platforms, and Google Sheets.
- Industry-Specific Data Modeling Templates: Accelerate report creation using pre-built models.
- Self-Service Analytics: Enable business users to independently run and customize reports within spreadsheets.
- Automated Reporting & Scheduling: Set flexible schedules (hourly, daily, weekly, monthly) for report refreshes.
- Shared Data Marts & Access Control: Facilitate secure collaboration between data and business teams.
- Automated Data Visualization: Automatically convert tabular data into charts and pivots.
Use Cases
- Automating business reporting in Google Sheets.
- Enabling self-service analytics for non-technical business users.
- Streamlining data preparation, blending, and modeling workflows.
- Improving collaboration between data analysts and business departments.
- Tracking marketing campaign performance and ad spend ROI.
- Establishing a reliable single source of truth for corporate data.
- Reducing manual effort and costs associated with reporting.
- Visualizing complex data through automatically generated charts and pivots.
FAQs
-
Which OWOX BI plan is right for my business?
Start with the FREE plan for basic spreadsheet reporting automation. The STARTER plan is for single data professionals supporting multiple users. The TEAM plan enhances productivity and collaboration for teams. The CORPORATE plan offers tailored solutions, enterprise features, advanced analytics tools, and dedicated support for large teams. -
What are credits and how are they used?
Credits are consumed for actions like running reports from data storage to spreadsheets or processing data from spreadsheets into storage. For example, 10 report runs equal 1 credit. Different plans include varying amounts of monthly credits (5 for Free, 15 for Starter, 20+ per seat for Team). -
How is the cost of OWOX BI pricing plans determined?
Plans are credit-based, meaning you pay for usage. Each plan (Free, Starter, Team, Corporate) includes a certain number of credits per month. Team plan credits are pooled, and Corporate offers custom/unlimited credits. -
Can I cancel my subscription?
Yes, you can cancel your subscription at any time. Your account will remain active until the end of the current billing period. -
What data sources can OWOX BI connect to?
OWOX BI connects to various sources. The Free plan supports 8 sources (e.g., Facebook, Google Ads, Google Sheets, BigQuery). Paid plans offer more, with the Corporate plan supporting over 155 data sources.
Related Queries
Helpful for people in the following professions
OWOX BI Uptime Monitor
Average Uptime
99.86%
Average Response Time
129.57 ms
Featured Tools
Join Our Newsletter
Stay updated with the latest AI tools, news, and offers by subscribing to our weekly newsletter.


