ReddRadar

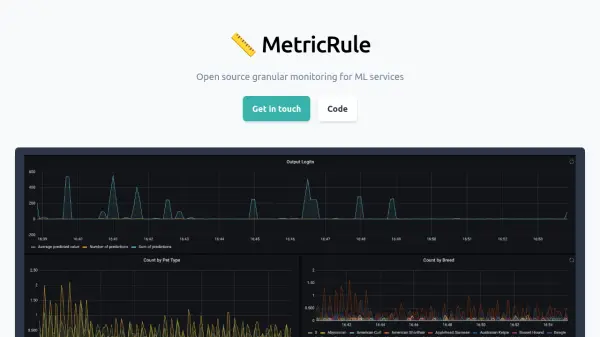
What is MetricRule?
MetricRule is an open-source solution designed for monitoring machine learning (ML) services operating in production environments. It facilitates granular tracking by automatically generating metrics for the inputs and outputs of ML models. This allows teams to monitor performance, identify potential issues like feature drifts or unexpected data patterns, and get alerted on suboptimal model deployments.
By integrating with existing model serving stacks such as Tensorflow Serving, KFServing, FastAPI, and Flask, MetricRule provides real-time insights into production features and predictions. Its metrics can be easily integrated into standard observability tools like Prometheus and Grafana, offering a comprehensive view of model behavior and health within the existing monitoring infrastructure.
By integrating with existing model serving stacks such as Tensorflow Serving, KFServing, FastAPI, and Flask, MetricRule provides real-time insights into production features and predictions. Its metrics can be easily integrated into standard observability tools like Prometheus and Grafana, offering a comprehensive view of model behavior and health within the existing monitoring infrastructure.
Features
- Automatic Metric Creation: Generates metrics for ML service inputs and outputs automatically.
- Compatibility: Works with popular model serving stacks like Tensorflow Serving, KFServing, FastAPI, and Flask.
- Observability Integration: Pluggable into standard observability tools such as Prometheus and Grafana.
- Real-time Monitoring: Provides real-time data on production features and predictions.
- Open Source: Available as an open-source tool.
Use Cases
- Monitoring ML model performance in production.
- Detecting feature drifts in real-time.
- Identifying unexpected input data patterns.
- Getting alerted on poorly performing model deployments.
- Diagnosing model issues specific to data slices.
- Integrating ML model monitoring into existing observability stacks.