 ReddRadar

Menu Explain Uptime Monitor
Translate & Visualize Menus with Images
Last 30 Days Performance
Average Uptime
0%
Based on 30-day monitoring period
Average Response Time
0ms
Mean response time across all checks
Daily Status Overview
Hover for detailsHistorical Performance
Jan-2026
100% uptime
Monthly Uptime
100%
Monthly Response Time
125ms
Daily Status Breakdown
Dec-2025
100% uptime
Monthly Uptime
100%
Monthly Response Time
147ms
Daily Status Breakdown
Nov-2025
100% uptime
Monthly Uptime
100%
Monthly Response Time
140ms
Daily Status Breakdown
Oct-2025
100% uptime
Monthly Uptime
100%
Monthly Response Time
131ms
Daily Status Breakdown
Sep-2025
100% uptime
Monthly Uptime
100%
Monthly Response Time
135ms
Daily Status Breakdown
Aug-2025
100% uptime
Monthly Uptime
100%
Monthly Response Time
137ms
Daily Status Breakdown
Jul-2025
99.45% uptime
Monthly Uptime
99.45%
Monthly Response Time
140ms
Daily Status Breakdown
Jun-2025
100% uptime
Monthly Uptime
100%
Monthly Response Time
162ms
Daily Status Breakdown
Related Uptime Monitors
Explore uptime status for similar tools that also have monitoring enabled.
-
 Operational
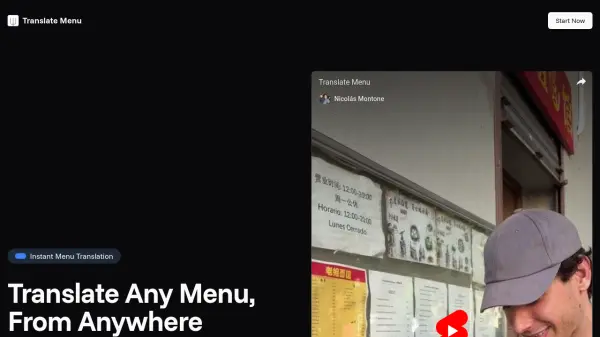
Translate Menu
Instant Menu Translation, From Anywhere
Translate Menu provides instant translations of menus from any language. Simply snap a photo to receive translations and personalized dish recommendations.
Last checked: 1 month ago View Status -
 Operational
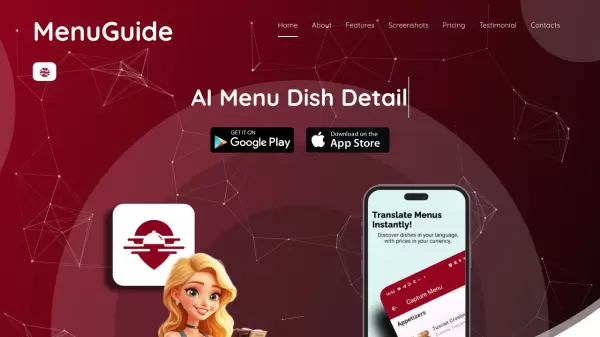
MenuGuide
Break language barriers in dining with AI-powered menu translation
MenuGuide is an AI-powered menu translation app that helps travelers and food enthusiasts understand menus in over 100 languages, providing instant translations, dish details, and nutritional information.
Last checked: 1 month ago View Status -
 Operational
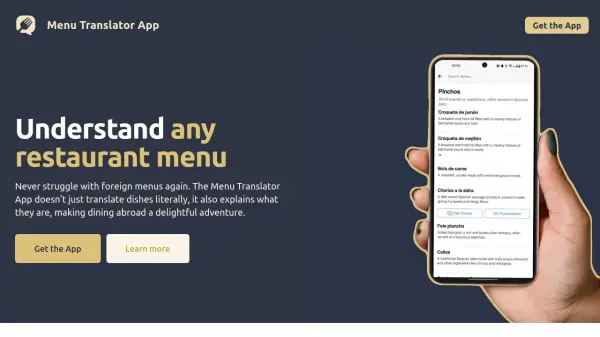
Menu Translator App
Understand Any Restaurant Menu
Menu Translator App translates and explains dishes on foreign menus, providing detailed descriptions and dietary information to enhance your dining experience abroad.
Last checked: 1 month ago View Status -
 Operational
Translate Image
Translate Images with AI, Accurately and Fast
Translate Image is an AI-powered online tool that translates text within images into over 100 languages while preserving the original layout and style.
Last checked: 1 month ago View Status -
 Operational
My Menu
All-in-one digital menu platform for restaurants, bars, cafes, and hotels
My Menu is an AI-powered digital menu platform that helps restaurants, bars, cafes, and hotels increase sales by 30% through QR codes, tablet menus, online ordering, and guest engagement tools.
Last checked: 1 month ago View Status -
 Operational
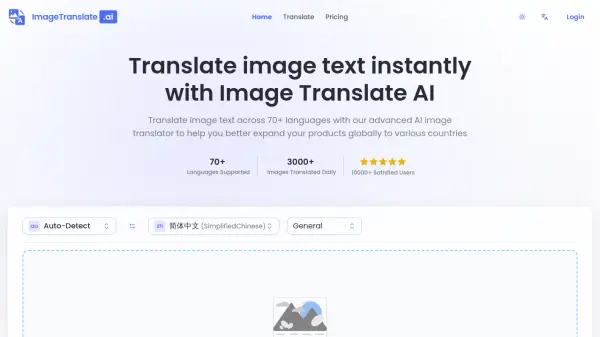
ImageTranslate.ai
Translate image text instantly with Image Translate AI
ImageTranslate.ai is an AI-powered tool for instantly translating text within images across 70+ languages while preserving the original layout. Ideal for global product expansion and localization.
Last checked: 1 month ago View Status