
What is Line Graph Maker?
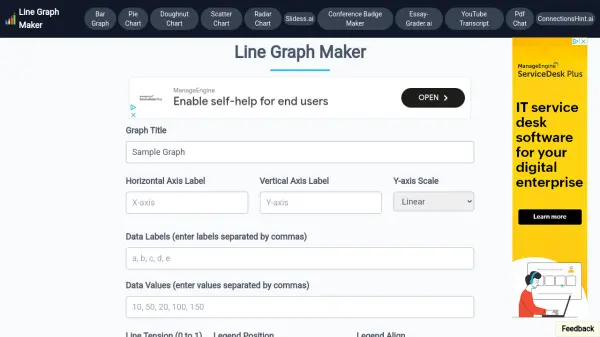
Line Graph Maker is an online tool designed for creating various types of graphs, with a primary focus on line graphs. Users can input their data and customize the appearance of their graphs through a simple interface.
The tool allows customization of graph titles, axis labels, data labels, line tension, legend position, and more. Once the graph is configured, users can download it in PNG, JPG, or SVG formats.
Features
- Graph Title: Add a title to your graph.
- Horizontal and Vertical Axis Labels: Add labels for both axes.
- Data Labels: Enter labels for data points separated by commas.
- Data Values: Enter corresponding values for each data label separated by commas.
- Line Tension: Adjust line smoothness with a value between 0 and 1.
- Legend Position: Choose the position of the legend (Top, Left, Bottom, Right).
- Y-axis Scale: Linear or Logarithmic.
- Chart Area Customization: Customize legend alignment and starting point of y axis.
- Grid Lines: Show or hide X and Y axis grid lines.
- Line Color: Select the color of the line.
Use Cases
- Creating line graphs for presentations
- Visualizing data trends
- Generating charts for reports
- Analyzing data sets
- Educational purposes
Related Queries
Helpful for people in the following professions
Line Graph Maker Uptime Monitor
Average Uptime
0%
Average Response Time
0 ms