 ReddRadar

InstaCharts Uptime Monitor
Instant Data Visualization and Smart Chart Creation
Last 30 Days Performance
Average Uptime
0%
Based on 30-day monitoring period
Average Response Time
0ms
Mean response time across all checks
Daily Status Overview
Hover for detailsHistorical Performance
Jan-2026
100% uptime
Monthly Uptime
100%
Monthly Response Time
79ms
Daily Status Breakdown
Dec-2025
100% uptime
Monthly Uptime
100%
Monthly Response Time
81ms
Daily Status Breakdown
Nov-2025
99.71% uptime
Monthly Uptime
99.71%
Monthly Response Time
84ms
Daily Status Breakdown
Oct-2025
100% uptime
Monthly Uptime
100%
Monthly Response Time
85ms
Daily Status Breakdown
Sep-2025
99.85% uptime
Monthly Uptime
99.85%
Monthly Response Time
90ms
Daily Status Breakdown
Aug-2025
99.85% uptime
Monthly Uptime
99.85%
Monthly Response Time
129ms
Daily Status Breakdown
Jul-2025
100% uptime
Monthly Uptime
100%
Monthly Response Time
83ms
Daily Status Breakdown
Jun-2025
100% uptime
Monthly Uptime
100%
Monthly Response Time
88ms
Daily Status Breakdown
Related Uptime Monitors
Explore uptime status for similar tools that also have monitoring enabled.
-
 Operational
ImgCharts
Free Chart Maker for Amazing Visualizations
ImgCharts is a free online chart maker that enables users to create various types of charts instantly without requiring sign-up, offering a user-friendly interface for data visualization.
Last checked: 1 month ago View Status -
 Operational
My Little Chart
Rapid, Beautiful Chart Creation with Real-Time Data Sync
My Little Chart enables analysts and creatives to swiftly generate customizable, visually engaging charts and graphs, synchronizing data in real time for impactful presentations and seamless integration. Enjoy easy data imports, broad personalization, and effortless embedding across modern platforms.
Last checked: 1 month ago View Status -
 Operational
MakeCharts
Visualize Complexity into Clarity
MakeCharts is an AI-powered visualization tool that transforms data, ideas, and plans into clear, shareable visuals including charts, diagrams, timelines, and frameworks in minutes.
Last checked: 1 month ago View Status -
 Operational
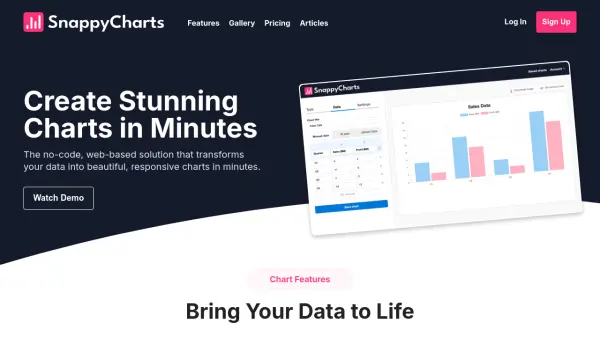
SnappyCharts
Create stunning charts in minutes with no coding required
SnappyCharts is a no-code, web-based solution that transforms data into beautiful, responsive charts quickly and easily.
Last checked: 1 month ago View Status -
 Operational
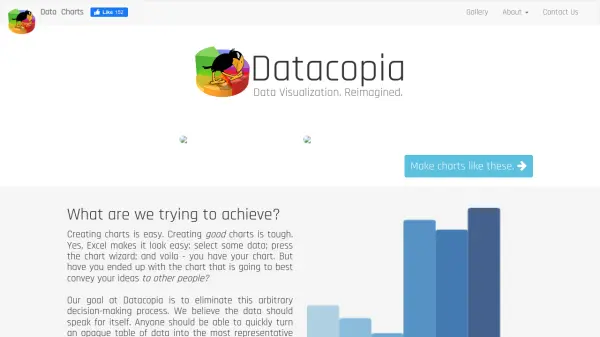
Datacopia
Effortless Data Visualization for Everyone
Datacopia enables users to effortlessly generate a wide variety of charts and graphs from their data, streamlining data analysis and visualization tasks.
Last checked: 1 month ago View Status -
 Operational
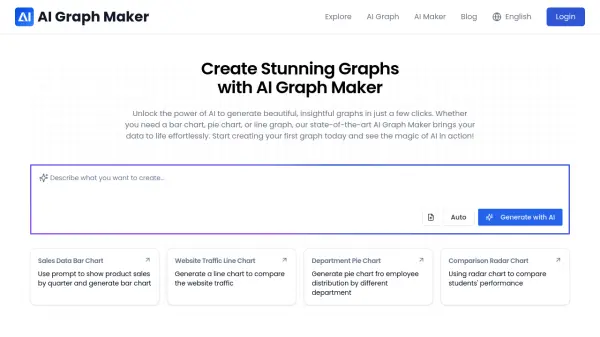
AI Graph Maker
Create Stunning Graphs with AI
AI Graph Maker uses AI to generate various types of insightful graphs, including bar charts, pie charts, and line graphs. Start creating data visualizations effortlessly.
Last checked: 1 month ago View Status