ReddRadar

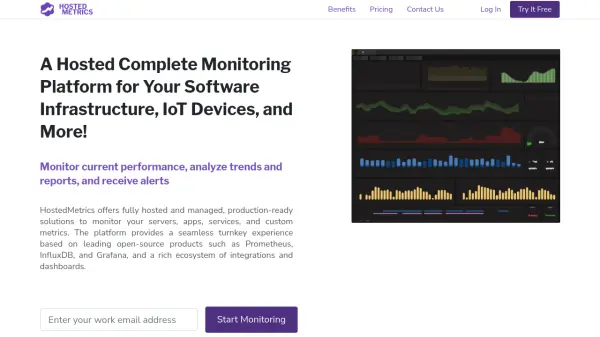
What is HostedMetrics?
HostedMetrics provides a comprehensive monitoring solution for businesses seeking reliability, scalability, and ease of use without the operational burden of managing infrastructure. Leveraging trusted open-source technologies such as Prometheus, InfluxDB, and Grafana, the service offers out-of-the-box metrics collection, rich dashboarding, and seamless alerting capabilities across servers, applications, and IoT devices.
Organizations benefit from fast onboarding, zero-maintenance operation, and deep integration with a wide ecosystem of tools and cloud platforms. HostedMetrics includes extensive support options and consulting services, allowing teams to focus on their core business objectives while gaining actionable insights from real-time data—all within a secure, production-ready environment.
Features
- Turnkey Monitoring Platform: Ready-to-use hosted solution based on Prometheus, InfluxDB, and Grafana.
- Zero Maintenance: No server setup, scaling, or ongoing infrastructure management required.
- Flexible Metric Collection: Supports industry-standard protocols (StatsD, MQTT, CloudWatch) and integrations with AWS, Azure, GCP, Kubernetes, Docker, and more.
- Powerful Visualization: Create, import, and customize dashboards with Grafana.
- Granular Alerting: Set up sophisticated alert rules and receive notifications via email, Slack, Telegram, webhooks, PagerDuty, VictorOps, and more.
- Role-Based Access Control: Manage team roles with RBAC for secure and organized collaboration.
- Data Retention & Resolution: Tailor retention periods and data granularity to meet engineering needs.
- Onboarding & Consulting Support: Personalized assistance and consulting on setup, architecture, and dashboard configuration.
- White-Label Grafana: Enterprise options to customize Grafana with your company branding (enterprise plans).
- Auditing & SSO: Access auditing features and support for Single Sign-On (OAuth, SAML, etc.).
Use Cases
- Monitoring cloud infrastructure performance and uptime for SaaS platforms.
- Collecting and visualizing IoT device data for fleet analysis and operational insights.
- Setting up custom dashboards for server and service health metrics.
- Configuring real-time alerts for critical application thresholds.
- Integrating deployment and development activity indicators into monitoring flows.
- Providing data-driven insights for DevOps, engineering, and IT operations teams.
- Automating incident responses through integrations with incident management platforms.
FAQs
-
How long does the free trial last?
The free trial lasts 14 days, and can be extended upon request if more evaluation time is needed. -
Can I change my payment method?
Yes, payment methods can be changed at any time via billing settings. -
What happens if I exceed my plan limits?
You will be notified when nearing usage limits and can upgrade your plan or adjust data retention accordingly. -
What integrations are supported?
The platform integrates with industry-standard protocols and services such as StatsD, MQTT, CloudWatch, AWS, Azure, GCP, Kubernetes, Docker, Nginx, Github, CI/CD tools, email, Slack, Telegram, PagerDuty, and more. -
What is whitelabeling for Grafana?
White-labeling allows enterprise customers to provide Grafana instances under their own domain with strict client data compartmentalization.