 ReddRadar

Graphbook Uptime Monitor
The open source tool for visual AI development
Last 30 Days Performance
Average Uptime
0%
Based on 30-day monitoring period
Average Response Time
0ms
Mean response time across all checks
Daily Status Overview
Hover for detailsRelated Uptime Monitors
Explore uptime status for similar tools that also have monitoring enabled.
-
 Operational
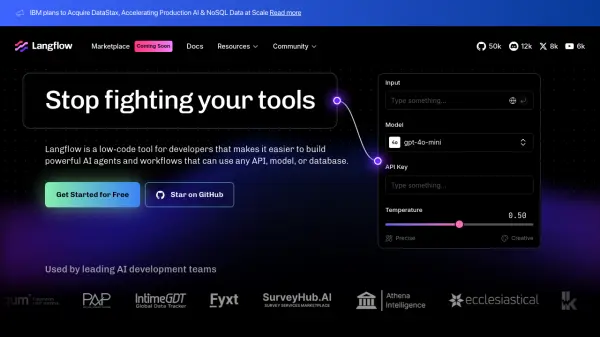
Langflow
Build Powerful AI Agents and Workflows Visually
Langflow is a low-code tool that simplifies the creation of AI agents and workflows for developers. It allows integration with any API, model, or database.
Last checked: 1 month ago View Status -
 Operational
Neuralhub
Design Deep Neural Networks in a Collaborative Playground
Neuralhub is a comprehensive platform for building, tuning, and experimenting with neural networks, offering tools and resources for AI enthusiasts, researchers, and engineers in a collaborative environment.
Last checked: 1 month ago View Status -
 Operational
CopilotKit
Open-source platform for seamless AI copilot integration
CopilotKit is an open-source development platform that enables seamless integration of AI copilots into applications, offering features like headless UI, generative UI, and intelligent suggestions.
Last checked: 1 month ago View Status -
 Operational
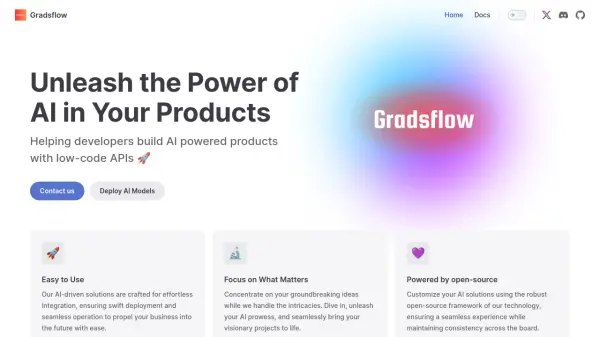
Gradsflow
Unleash the Power of AI in Your Products
Gradsflow helps developers build AI-powered products with low-code APIs. It offers easy-to-use, customizable, and open-source AI solutions for seamless integration and deployment.
Last checked: 1 month ago View Status -
 Operational
Louie.AI
GenAI-first analyst notebooks for effortless data analysis and automation
Louie.AI is a comprehensive genAI-native analytics platform that combines natural language processing with powerful data science tools, offering interactive notebooks, AI dashboarding, and automation APIs for enterprise-grade data analysis.
Last checked: 1 month ago View Status -
 Operational
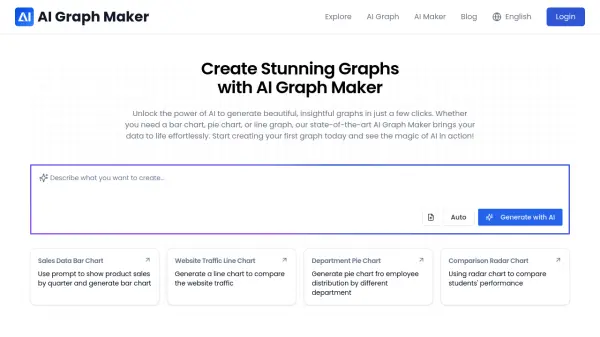
AI Graph Maker
Create Stunning Graphs with AI
AI Graph Maker uses AI to generate various types of insightful graphs, including bar charts, pie charts, and line graphs. Start creating data visualizations effortlessly.
Last checked: 1 month ago View Status