 ReddRadar

GitDiagram Uptime Monitor
Visualize GitHub Repositories as Interactive Diagrams
Last 30 Days Performance
Average Uptime
0%
Based on 30-day monitoring period
Average Response Time
0ms
Mean response time across all checks
Daily Status Overview
Hover for detailsHistorical Performance
Jan-2026
0% uptime
Monthly Uptime
0%
Monthly Response Time
0ms
Daily Status Breakdown
Dec-2025
0% uptime
Monthly Uptime
0%
Monthly Response Time
0ms
Daily Status Breakdown
Nov-2025
97.22% uptime
Monthly Uptime
97.22%
Monthly Response Time
98ms
Daily Status Breakdown
Oct-2025
100% uptime
Monthly Uptime
100%
Monthly Response Time
98ms
Daily Status Breakdown
Sep-2025
99.84% uptime
Monthly Uptime
99.84%
Monthly Response Time
97ms
Daily Status Breakdown
Aug-2025
100% uptime
Monthly Uptime
100%
Monthly Response Time
103ms
Daily Status Breakdown
Jul-2025
100% uptime
Monthly Uptime
100%
Monthly Response Time
94ms
Daily Status Breakdown
Jun-2025
100% uptime
Monthly Uptime
100%
Monthly Response Time
105ms
Daily Status Breakdown
Related Uptime Monitors
Explore uptime status for similar tools that also have monitoring enabled.
-
 Operational
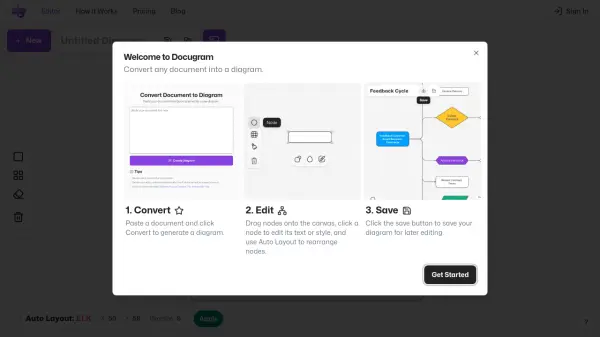
Docugram
Transform documents into dynamic flowcharts effortlessly.
Docugram converts documents into interactive flowcharts. It offers a user-friendly interface with automatic layout algorithms and customizable design elements, enhancing project management and strategic planning.
Last checked: 1 month ago View Status -
 Operational
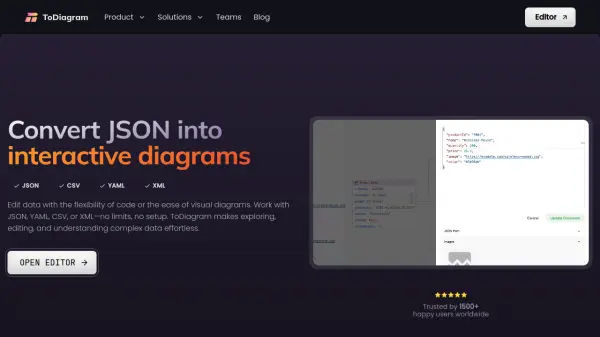
ToDiagram
Convert data into interactive diagrams
ToDiagram is a web-based tool that transforms structured data formats like JSON, CSV, YAML, and XML into interactive diagrams for easier analysis and editing.
Last checked: 1 month ago View Status -
 Operational
Schema Visualizer
Build & visualize your data schemas together
Schema Visualizer is an AI-powered platform that automatically generates visualizations for data schemas in JSON, XML, Proto, GraphQL, Prisma, and other formats, enabling teams to collaborate, document, and synchronize changes with GitHub.
Last checked: 1 month ago View Status -
 Operational
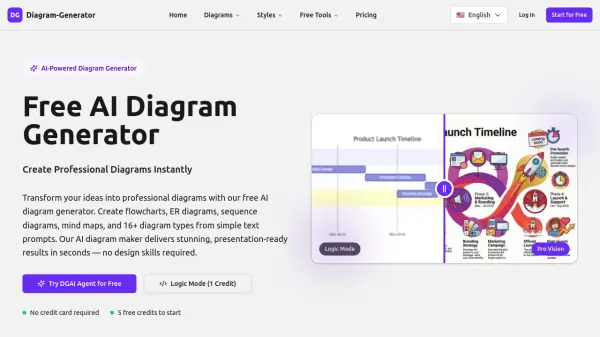
Diagram-Generator
AI-Powered Diagram Generator for Professional Visualizations
Diagram-Generator is an AI-powered tool that transforms text prompts into professional diagrams instantly, supporting 16+ diagram types including flowcharts, ER diagrams, and mind maps with no design skills required.
Last checked: 1 month ago View Status -
 Issues
Lovely Charts
Create professional diagrams for your website with ease
Lovely Charts helps users create various types of professional diagrams including flowcharts, sitemaps, business processes, organization charts, and wireframes for website integration.
Last checked: 1 month ago View Status -
 Operational
gitdevtool.com
Your Essential GitHub Toolkit
GitDevTool offers an AI-powered toolkit designed to enhance GitHub projects with features like README generation, traffic analysis, and profile optimization.
Last checked: 1 month ago View Status