EzyGraph Uptime Monitor
Create infographics instantly from simple text prompts, blog contents or URLs — turning complex data into clear, engaging visual stories
Last 30 Days Performance
Average Uptime
92.99%
Based on 30-day monitoring period
Average Response Time
2860.9ms
Mean response time across all checks
Daily Status Overview
Hover for detailsHistorical Performance
Dec-2025
99.13% uptime
Monthly Uptime
99.13%
Monthly Response Time
3803ms
Daily Status Breakdown
Nov-2025
99% uptime
Monthly Uptime
99%
Monthly Response Time
3720ms
Daily Status Breakdown
Oct-2025
99.2% uptime
Monthly Uptime
99.2%
Monthly Response Time
3560ms
Daily Status Breakdown
Sep-2025
99.41% uptime
Monthly Uptime
99.41%
Monthly Response Time
3640ms
Daily Status Breakdown
Aug-2025
70.86% uptime
Monthly Uptime
70.86%
Monthly Response Time
3125ms
Daily Status Breakdown
Jul-2025
23.84% uptime
Monthly Uptime
23.84%
Monthly Response Time
1723ms
Daily Status Breakdown
Jun-2025
70.56% uptime
Monthly Uptime
70.56%
Monthly Response Time
1066ms
Daily Status Breakdown
May-2025
100% uptime
Monthly Uptime
100%
Monthly Response Time
487ms
Daily Status Breakdown
Apr-2025
99.65% uptime
Monthly Uptime
99.65%
Monthly Response Time
479ms
Daily Status Breakdown
Related Uptime Monitors
Explore uptime status for similar tools that also have monitoring enabled.
-
 Operational
Ainfographic
Turn blog posts into scroll-stopping infographics.
Ainfographic is an AI-powered tool that instantly transforms blog posts or any content URL into visually appealing and shareable infographics.
Last checked: 9 hours ago View Status -
 Operational
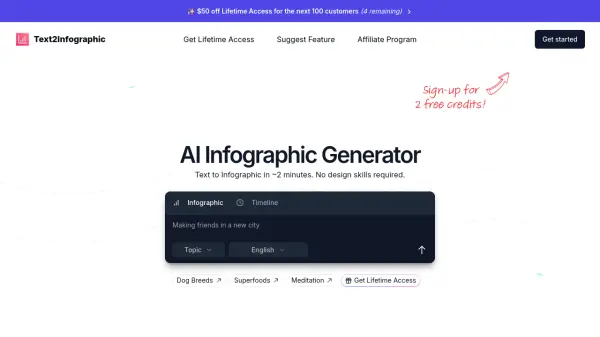
Text2Infographic
AI Infographic Generator
Text2Infographic is an AI-powered tool that transforms text into engaging infographics in approximately 2 minutes, saving time and design costs.
Last checked: 2 hours ago View Status -
 Operational
AI Infographics
Create stunning visuals from text with AI Infographics
AI Infographics transforms text into engaging, customizable infographics for reports, blogs, presentations, and social media using artificial intelligence.
Last checked: 9 hours ago View Status -
 Operational
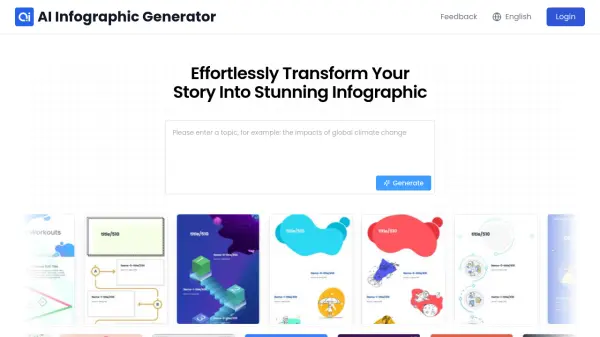
InfographAI
Effortlessly Transform Your Story Into Stunning Infographics
InfographAI is an AI-powered infographic generator that transforms data and content into professional-quality visual presentations without requiring design skills. It offers smart layout optimization, automated data visualization, and customizable templates.
Last checked: 2 hours ago View Status -
 Issues
infographicgeneratorai.com
Create Amazing Infographics
AI Infographics is a tool that generates stunning infographics for marketing and business using AI. Create high-quality visuals easily by describing your needs and optionally uploading data.
Last checked: 9 hours ago View Status -
 Operational
GraphicInfo
Transform Your Content Into Stunning Infographics
GraphicInfo is an AI-powered tool that transforms content into professional infographics in seconds, offering instant visualization and customization capabilities.
Last checked: 2 hours ago View Status