Explain Everything Uptime Monitor
The Leading Online Whiteboard for Teaching and Collaboration
Last 30 Days Performance
Average Uptime
100%
Based on 30-day monitoring period
Average Response Time
644.53ms
Mean response time across all checks
Daily Status Overview
Hover for detailsHistorical Performance
Dec-2025
100% uptime
Monthly Uptime
100%
Monthly Response Time
665ms
Daily Status Breakdown
Nov-2025
99.86% uptime
Monthly Uptime
99.86%
Monthly Response Time
653ms
Daily Status Breakdown
Oct-2025
100% uptime
Monthly Uptime
100%
Monthly Response Time
423ms
Daily Status Breakdown
Sep-2025
99.85% uptime
Monthly Uptime
99.85%
Monthly Response Time
340ms
Daily Status Breakdown
Aug-2025
99.85% uptime
Monthly Uptime
99.85%
Monthly Response Time
355ms
Daily Status Breakdown
Jul-2025
99.87% uptime
Monthly Uptime
99.87%
Monthly Response Time
341ms
Daily Status Breakdown
Jun-2025
99.89% uptime
Monthly Uptime
99.89%
Monthly Response Time
353ms
Daily Status Breakdown
Related Uptime Monitors
Explore uptime status for similar tools that also have monitoring enabled.
-
 Operational
Whiteboard Recorder
Draw. Explain. Record. Share. All in your browser.
Whiteboard Recorder is an AI-powered online whiteboard tool that combines drawing, screen recording, and webcam overlay for creating tutorials, presentations, and educational content directly in your browser.
Last checked: 1 hour ago View Status -
 Issues
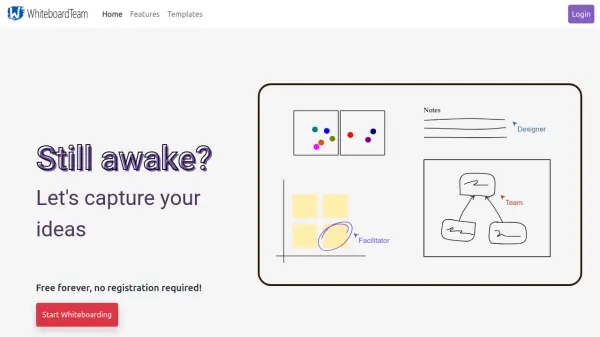
WhiteboardTeam
Online Collaborative Whiteboard for Teams and Education
WhiteboardTeam is a free online collaborative whiteboard platform that enables real-time teamwork, idea sharing, and visual planning without the need for registration or installation.
Last checked: 4 hours ago View Status -
 Operational
Scribblar
Collaborative Online Whiteboard for Engaging Remote Tutoring
Scribblar provides a safe and stable online collaborative environment featuring chat, audio, and virtual whiteboards, ideal for online tutoring and education.
Last checked: 1 hour ago View Status -
 Operational
Epic Pen
On-Screen Drawing and Annotation for Enhanced Communication
Epic Pen is a digital tool that allows users to draw and annotate directly over any application, streamlining communication, teaching, and collaboration through visual expression.
Last checked: 1 hour ago View Status -
 Operational
Lessonspace
The Platform for Virtual Classrooms and Online Tutoring
Lessonspace is an online teaching platform offering collaborative whiteboards, video calling, and management tools for virtual classrooms and tutoring, with a 14-day free trial.
Last checked: 2 hours ago View Status -
 Issues
Twiddla
Collaborative Online Whiteboard for Real-Time Teamwork
Twiddla is a browser-based online whiteboard that offers real-time collaboration, co-browsing, and annotation for education and remote teams, without requiring plug-ins or sign-ups.
Last checked: 1 hour ago View Status