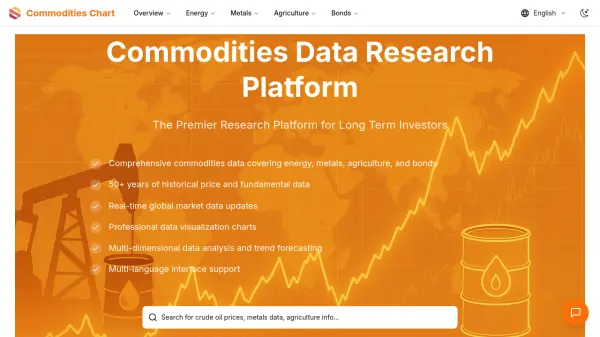
What is CommoditiesChart.net?
CommoditiesChart.net is a premier research and data visualization platform tailored for long-term investors, traders, and analysts in the commodities sector. The platform delivers comprehensive coverage of global markets including energy, metals, agriculture, and bonds with access to 50+ years of historical price and fundamental data alongside real-time updates.
Users benefit from professional charting tools, multi-dimensional data analysis, and trend forecasting functionalities, supporting informed decision-making across various commodity sectors. The platform supports multiple languages and provides timely data on production, consumption, imports, exports, and inventory changes, integrating crucial indicators like EIA and API reports as well as VLCC shipping rates to help analyze and build effective trading strategies.
Features
- Comprehensive Commodities Data: Covers energy, metals, agriculture, and bonds
- Extensive Historical Coverage: Over 50 years of historical price and fundamental data
- Real-Time Data Updates: Provides up-to-date global market statistics and trends
- Advanced Data Visualization: Professional-grade charts and analysis tools
- Multi-dimensional Analysis: Enables in-depth research and trend forecasting
- Multi-language Support: Interface available in multiple languages
- Market Dashboard: Consolidates key market and macroeconomic data for commodities
- API/EIA Inventory Reports Integration: Incorporates critical industry reports for oil sector analysis
- VLCC and Tanker Rate Monitoring: Tracks global oil shipping rates and supply chain indicators
- Frequent Data Refresh: Key indicators, such as oil imports and rig counts, updated weekly
Use Cases
- Analyzing long-term commodity market trends for investment decisions
- Developing and backtesting trading strategies for energy, metals, agriculture, or bond sectors
- Tracking global production, consumption, import, and export metrics for commodities
- Researching oil market movements including OPEC and shale oil dynamics
- Monitoring real-time VLCC and oil tanker rates for supply chain analysis
- Comparing historical price data for major commodities like crude oil, copper, and wheat
- Supporting academic or institutional research with comprehensive commodity datasets
FAQs
-
What types of commodities are covered on CommoditiesChart.net?
CommoditiesChart.net covers energy, metals, agriculture, and bonds, providing both real-time and historical data for each sector. -
How often is the commodity data updated?
Most key indicators such as crude oil imports, rig counts, and related statistics are updated on a weekly basis. -
Does the platform offer charting and data visualization tools?
Yes, CommoditiesChart.net includes professional-grade charts that enable advanced data visualization for effective market analysis. -
Can I view major oil benchmark prices and trading trends?
The platform provides data for major crude oil benchmarks such as WTI and Brent, along with trading trend analysis and futures curves. -
Does CommoditiesChart.net integrate with industry-standard reports?
Yes, the platform regularly updates with EIA and API inventory reports and incorporates these data into its analysis tools.
Related Queries
Helpful for people in the following professions
CommoditiesChart.net Uptime Monitor
Average Uptime
0%
Average Response Time
0 ms